Mastering technical analysis is the best way to become a profitable trader. There are 100’s of technical analysis trading strategies out there. But does these strategies work for both the forex market and the stock market?
Yes, most of the technical analysis will work in a similar way for both forex and stocks. Keep reading to learn more about technical analysis strategies to trade forex and stocks profitably.
Forex vs Stock Trading
There is a range of differences and similarities between the stock market and the forex market. But if you learn and master one market, it will become easier for you to master the other market. Personally, we prefer trading the forex market because of the following reasons.
Forex is the largest financial market in the world with over $6 trillion US dollars traded daily. For stocks, roughly $200 Billion US dollars are traded every day, which is a fraction of the forex market. This makes the forex market more liquid than the stock market. There is more opportunities in the forex market compared to the stock market.
Also, the forex market is open 24/7 5 days week. This is one of our favourite advantages of the forex market because you can trade any time you want. The forex market will be more suitable for most traders because of this. That said, you can become a profitable trader, trading either the forex market or the stock market. Now, let’s talk about what is technical analysis.
What is Technical Analysis?
Technical analysis is a way of analyzing financial markets. Technical analysis is different from fundamental analysis. Technical analysis is done on the financial charts, mainly the candlestick chart.
There are two main ways to do technical analysis. One is doing technical analysis with price action and the other is doing technical analysis with technical indicators. You can also use both methods in combination. We personally use both price action and technical indicators to analyse the forex market.
As we talked about before, there are 100’s of technical analysis strategies. Only some of these strategies are good. If you are beginner we recommend you to start with price action strategies. Now, let’s talk about how to do technical analysis in the forex and the stock market.
Technical Analysis For Trading Forex and Stocks
In this section, we will look at how to do some basic technical analysis, and in the next section, we will talk about more advanced trading strategies to trade forex or stocks.
Both forex and stocks have candlestick charts. That means these technical analysis methods will apply to both of these markets. Below shows a candlestick chart for AAPL (Apple NASDAQ Stocks) and EURUSD respectively.
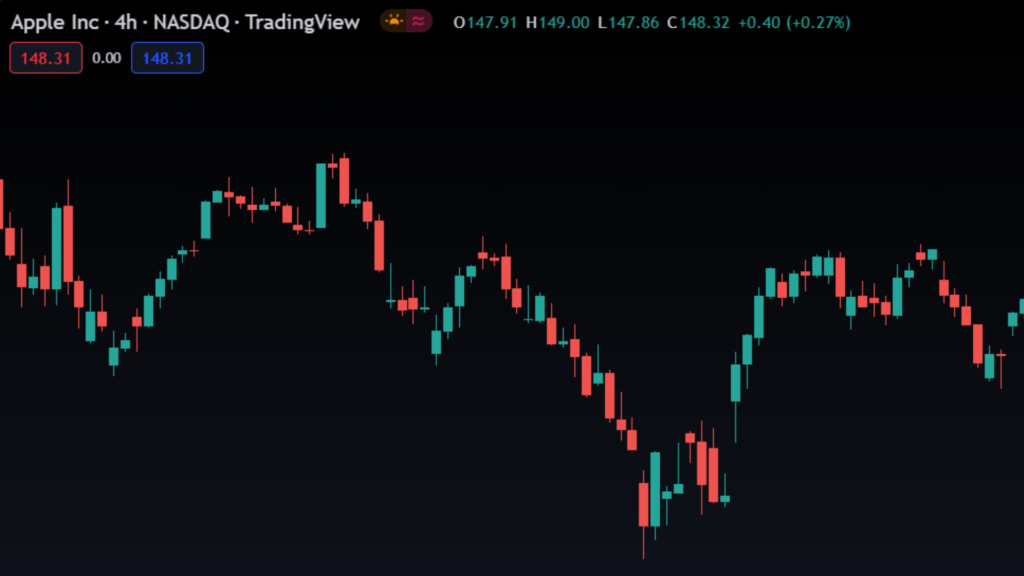
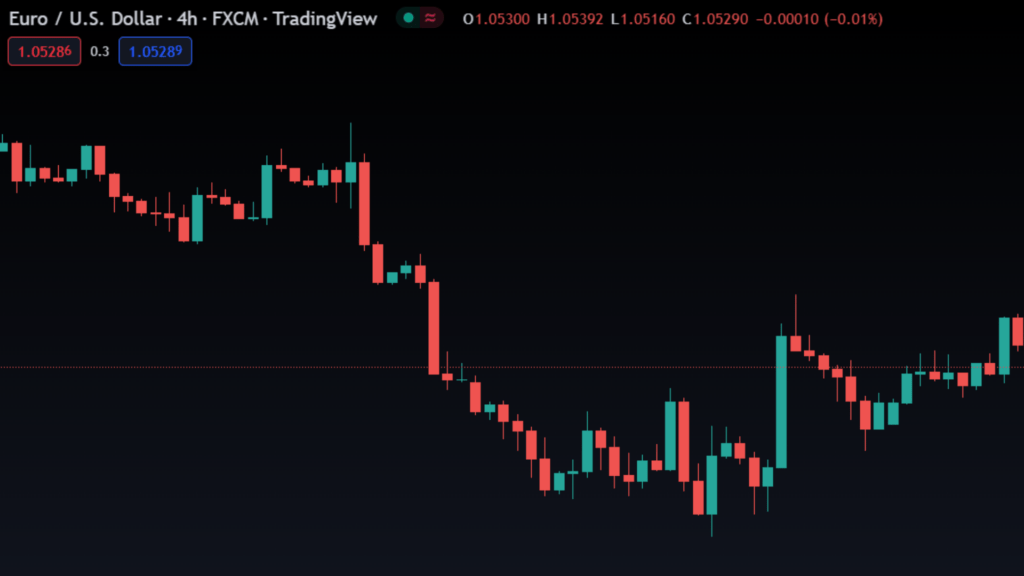
As you can see from the above figures, the forex and stock charts are very similar except for a very few differences. As you can see the stock charts have more gaps. This is because the stock market is only open from 9.30 am to 4 pm (US time). The forex market is open 24/7, 5 days a week, that’s why you will see lesser gaps in the forex market.
Both the stock and forex charts are compatible with most of the technical analysis tools such as resistance and support. The examples below show resistance and support drawn on a forex and a stock chart respectively.
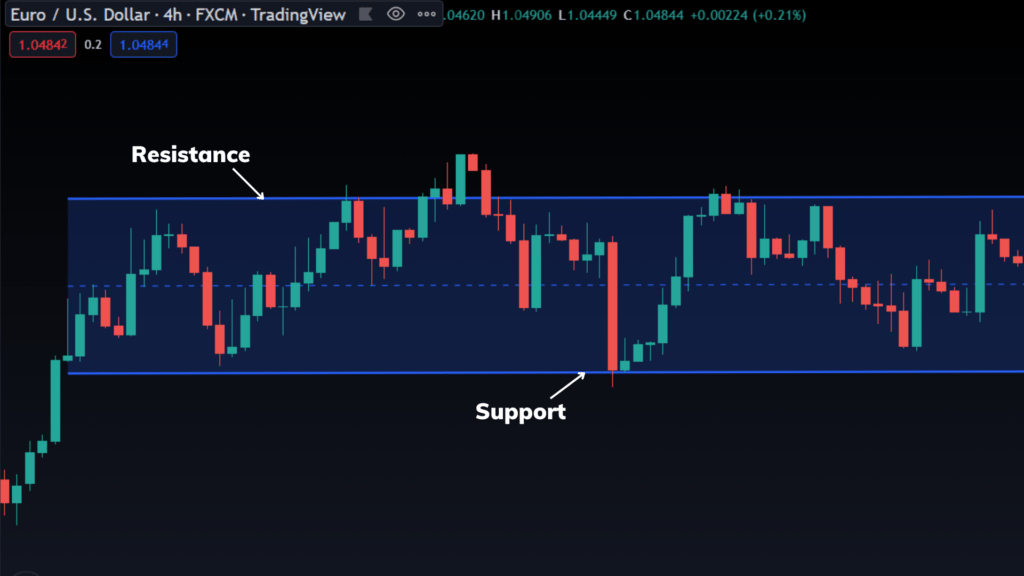
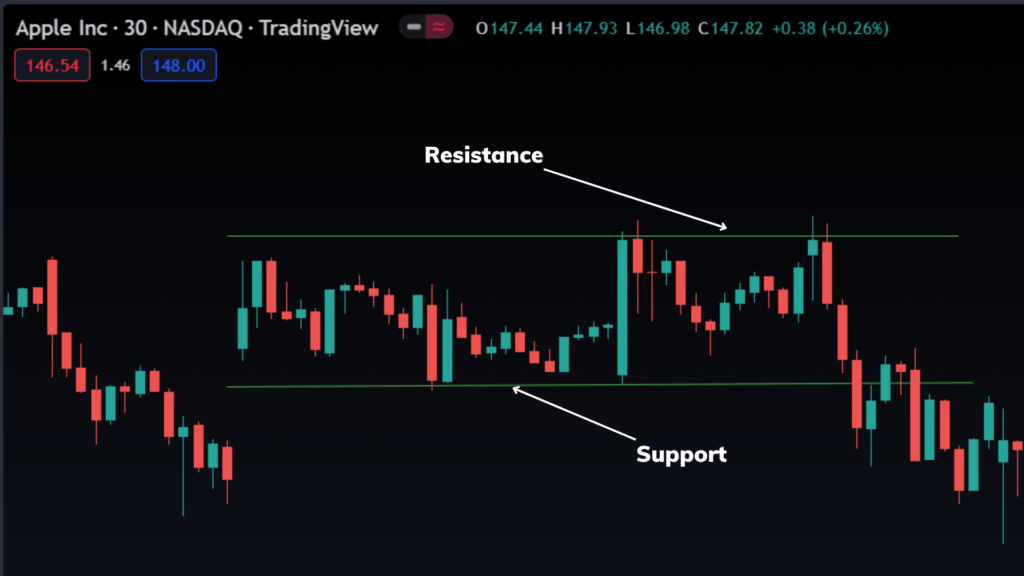
For both the forex and the stock charts, when the market reaches the support or the resistance, the market reverses. Learning how to place support and resistance properly is a very important skill for a trader. Now, let’s look at some advanced technical analysis strategies to make some profitable trades in the forex market and the stock market.
Forex & Stock Trading Strategies
Now, let’s look at a profitable technical analysis trading strategy that can be applied to both the stock and the forex markets. The strategy we will talk about is the breakout strategy. This strategy is a great trading strategy for both stock and forex trading. The chart below shows a breakout of the forex market for EURUSD.
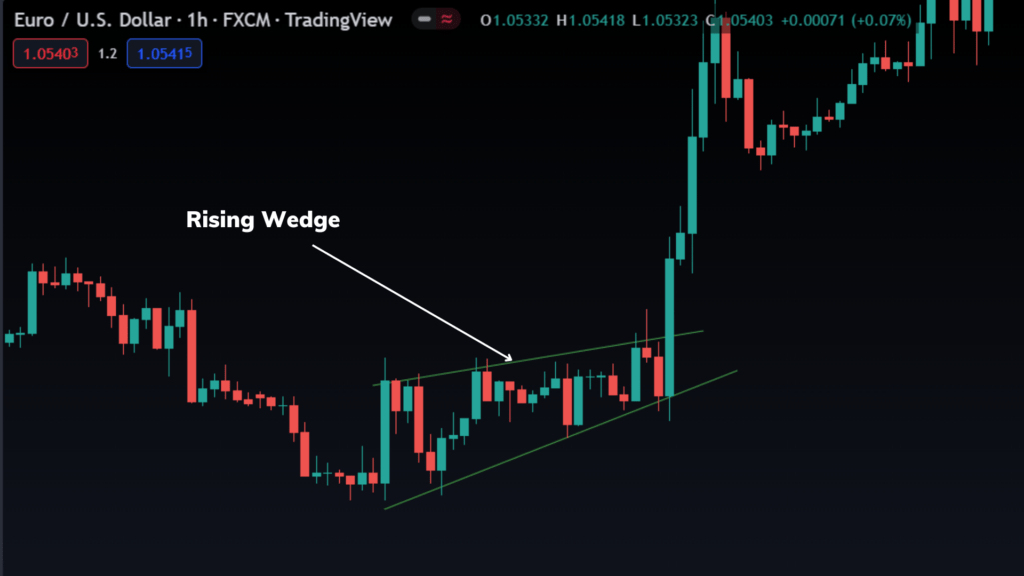
The above chart shows a breakout pattern formed in the EURUSD market. This chart pattern is called the rising wedge. As you can see the market breaks out at the end of the chart pattern. Some traders enter the trade immediately after the breakout. This can work, but sometimes it can be a false breakout. To reduce the risk of a breakout, wait for a pull back candle to complete before entering a trade.
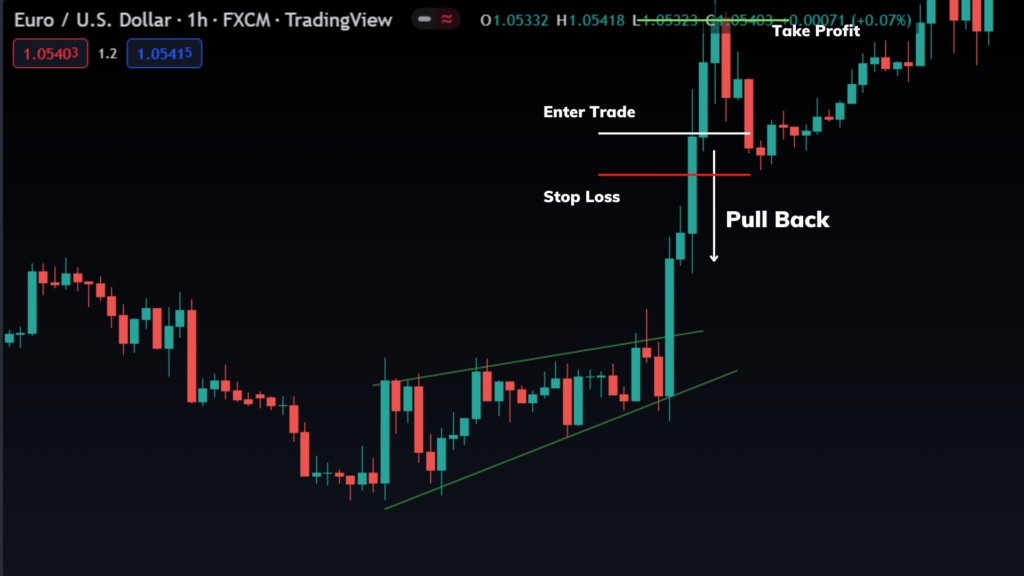
Now let’s apply this same strategy to the stock market. The chart below shows a breakout of the stock market AAPL.
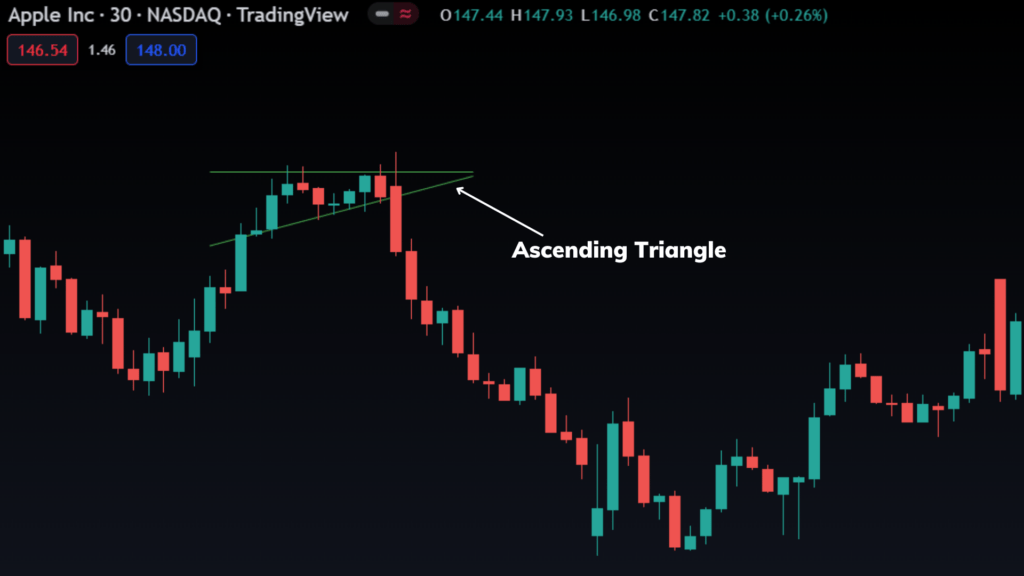
The chart pattern shown above is called an ascending triangle pattern. As you can see it is breakout pattern. The market breaks out at the end of the triangle. You can take a trade immediately after the breakout. But it is less risker to wait for a pull back before taking a trade.
If you are interested in learning more about different chart patterns make sure to check out our complete free forex trading guide.
Conclusion
Technical analysis is the best way to trade both the forex market and the stock market. There are several great trading strategies that can be applied to both the stock market and the forex market. We recommend you start with one market first and master that specific market.
Our recommendation is you start with the forex market. Mainly because you can trade anytime in the forex market, therefore it will be much easier for you to set time to trade in the forex market.
After you master forex you can trade stocks if you like. We recommend you check out our complete free guide to learn trading forex. We cover everything you need to become a profitable trader in the forex market.

