In this article, we will talk about the hull moving average and the weighted moving average. Also, we will talk about what is better for you to use for trading forex and a few trading strategies using the HMA and WMA.
Both the HMA and WMA are great moving averages that can be used in your trading strategy. Now let’s look at what the Hull moving average is.
What is Hull Moving Average?
Hull moving average, also called the HMA was founded by Allen Hull in 2005. The HMA indicator is a fast and smooth-moving average indicator. The goal of the Hull moving average was to minimize the lag of a traditional moving average. The following is the formula used to calculate the Hull moving average.
HMA = WMA(2*WMA(n/2)-WMA(n),sqrt(n))
where WMA = Weighted moving average.
You don’t have to know this formula in order to use the Hull moving average. There are several trading strategies that you can trade using the hull moving average. A common trading strategy using the hull moving average is to buy when the HMA turns up and sell when the HMA turns down. But this is not a very reliable strategy, it will not always work. The chart below shows this simple strategy with the HMA. This strategy works best in a ranging market.
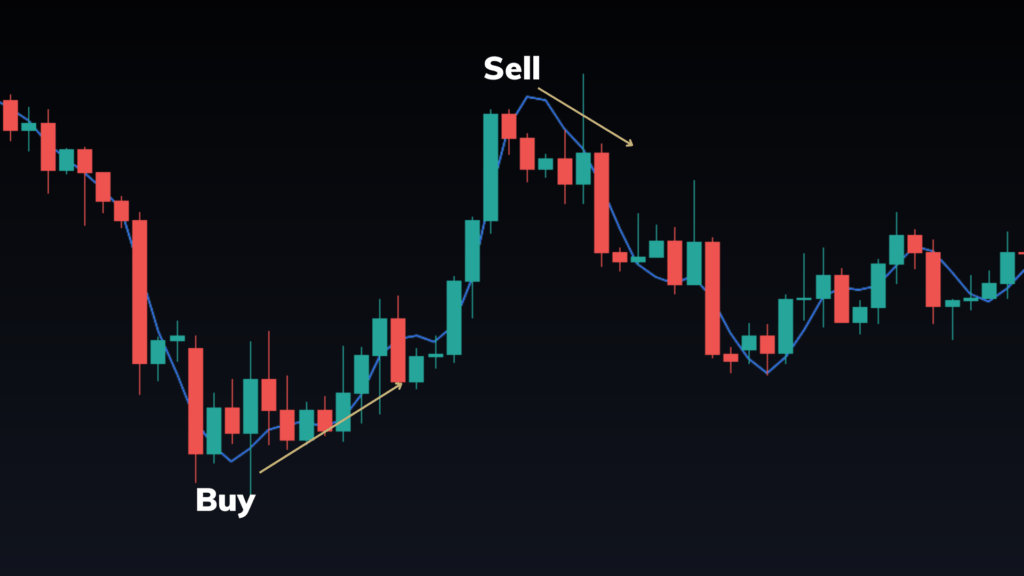
The best way to trade with HMA is to use it in combination with price action strategies. A good strategy to use with the HMA is the supply and demand strategy.
You can also use the HMA as a support or resistance similar to that of the Weighted moving average. We will look at this in the next section.
What is the Weighted Moving Average?
A weighted moving average, also known as the WMA puts more weight on the recent data in the market compared to the previous data. There are several ways to trade with the weighted moving average. You can use the WMA as support/resistance or mainly a trend direction indicator. The following is how the weighted moving average is calculated. For example for 7 period WMA, the calculation is,
WMA = (P1 * 7) + (P2 * 6) + (P3 * 5) + (P4 * 4) + (P5 * 3) + (P6 * 2) + (P7 * 1) / (7 + 6 +5 + 4+ 3 + 2 + 1)
Where P1 = the recent/current price, P2 the previous price, and so on.
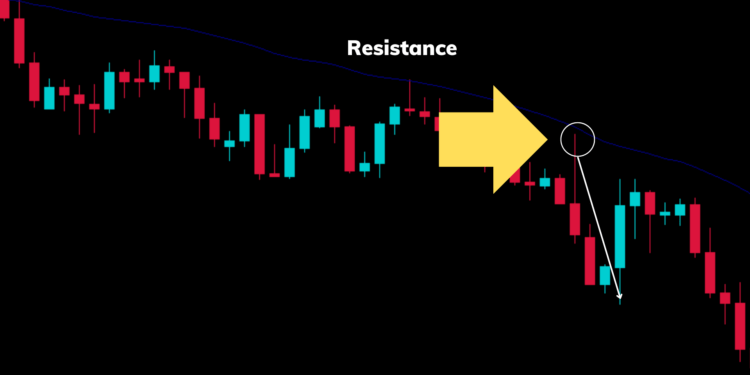
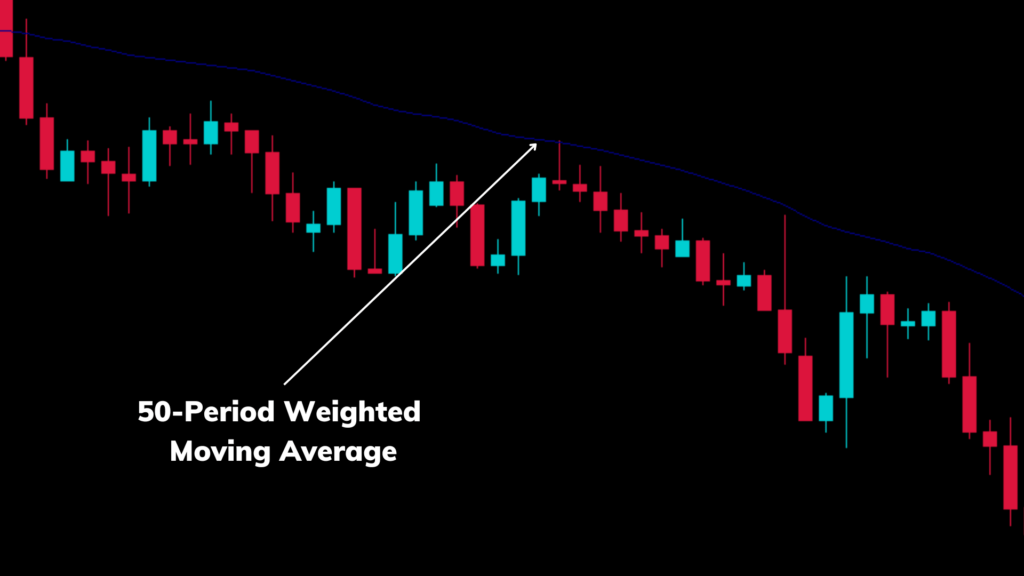
A weighted moving average that is bullish can act as dynamic support and a WMA that is bearish can act as a dynamic resistance. The following chart shows a 50-period Weighted Moving Average acting as a resistance.
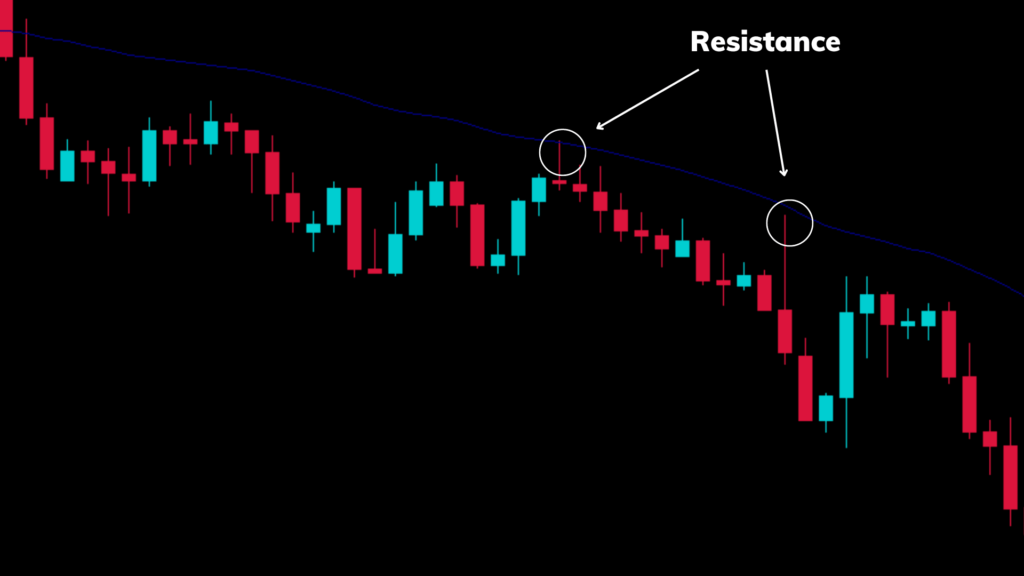
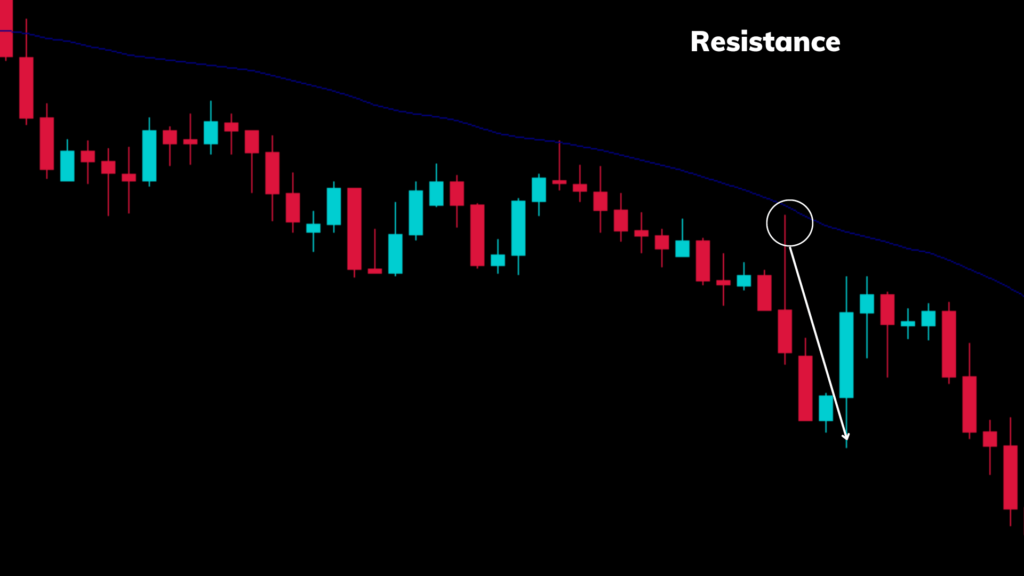
When the market touches the WMA for the second time it goes down as shown in the chart below. Incorporating WMA as resistance can be a great addition to your strategy.
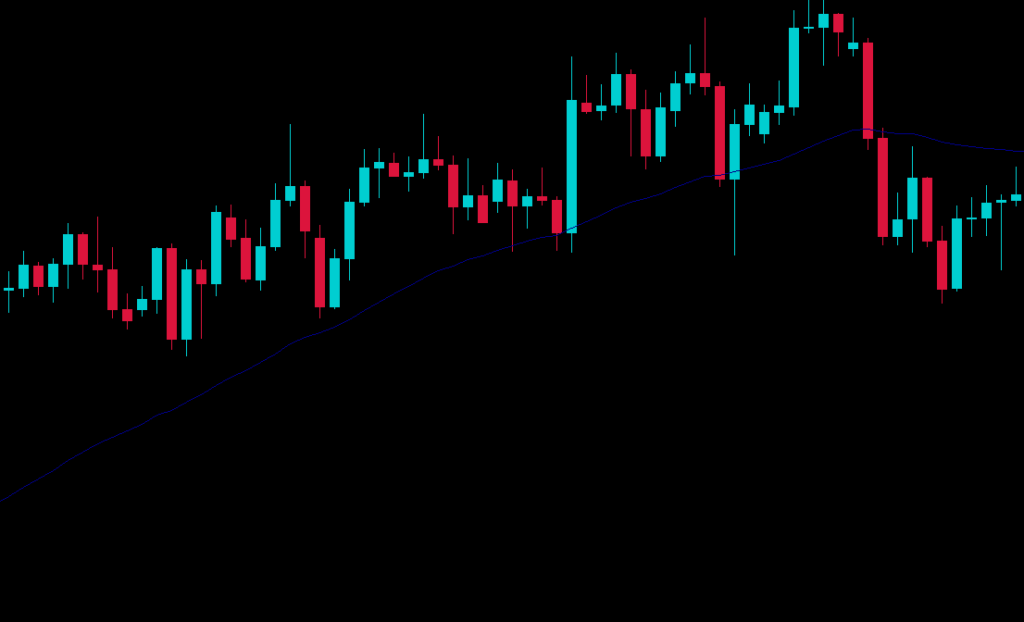
Now let’s look at another example of using the WMA. The chart below shows the WMA as support. As you can see when the market touches the WMA it bounces back.
HMA vs WMA, What is Better?
As you can see from the HMA formula, HMA is a combination of weighted moving averages. Actually, there is not much of a difference between HMA and WMA. Both the HMA and WMA can be used in your trading strategy.
We recommend you choose one of these two moving average indicators and back-test it with your trading strategy. If you are not sure how to back-test your trading strategy make sure to check out this guide on backtesting.
Conclusion
Both the HMA and WMA are great indicators that you can incorporate into your trading strategy. If you are interested in learning more about forex trading, make sure to check out our free forex guide.

