In this guide, we will talk about Forex Swing Trading with Supply and Demand Analysis. Learning about supply and demand is a great way to trade forex. Swing trading with supply and demand is great as well. There are several advantages to doing swing trading over day trading or scalping using supply and demand forex trading strategies.
What is Swing Trading
Swing trading is a trading style where you hold a trade for days or weeks. Swing trading is mainly done with a 4-hour chart and a daily chart. Sometimes you can use the 1-hour chart as well. For swing trading usually, we will not go below the 1-hour chart. There a quite a few trading strategies that you can use to swing trade profitably which we will discuss later.
Swing trading has a lot of advantages and a few disadvantages. Below we will take about the pros and cons of swing trading.
Advantages of Swing Trading
Swing trading is the best trading style for forex traders who have a really busy schedule and don’t have much time to trade. Swing trading is also great for any trader who doesn’t want to trade often and stare at the forex charts all day. We also do swing trading with some day trading.
With swing trading, you only need to trade for 30 minutes – 1 hour a day. This can fit most traders’ Schedules. Another great advantage is that with swing trading you don’t have to take too many trades. You can take 1-3 high-quality trades a week and be profitable.
Disadvantages of Swing Trading
Even though swing trading has great advantages there can be a few disadvantages to swing trading. The biggest disadvantage is that you will be holding your trades overnight. This can be very risky if the market does something you don’t expect overnight.
Also if you are holding a trade overnight you might be thinking about this trade which can mess up your sleep. But if you can control yourself with this Swing trading is great.
What is Supply and Demand?
Supply and Demand is very simply aggressive buying and aggressive selling. When there is a high supply (aggressive selling) the market is likely to go down (bearish market). When there is high demand (aggressive buying) the market is likely to go up (bullish market). The picture below shows supply and demand in a candlestick chart.
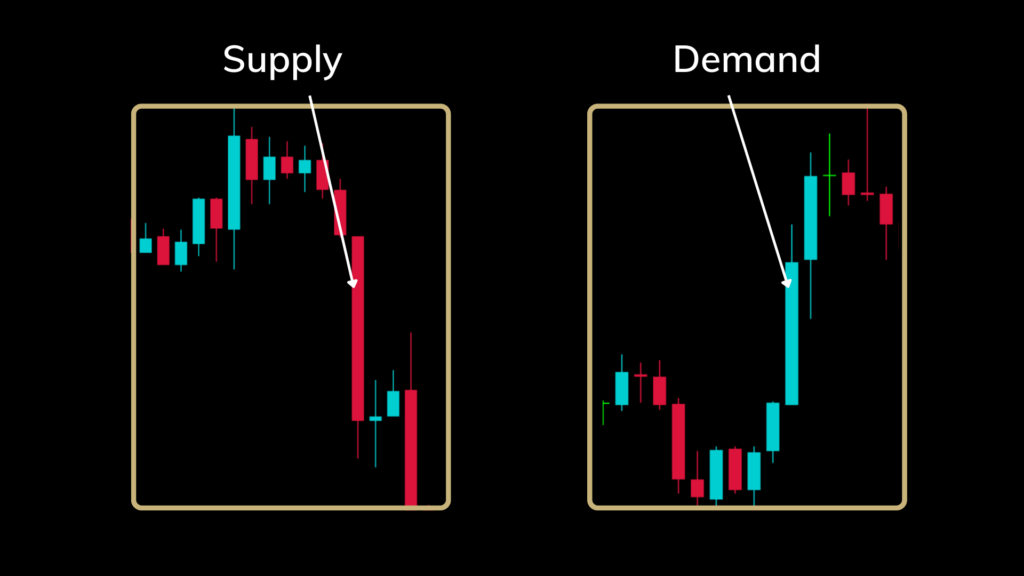
Let’s take supply for example in the above image (chart to the right). As you can see there are huge bearish candles with high volume behind them. This shows that the supply is high. If you look at the demand, you will see bullish candles with very high volume (chart to the left). For high supply/ demand, you need to see at least two candles with high volume in them. Sometimes you will see 5 or 6 candles with relatively high volumes. Below is another example of supply and demand.
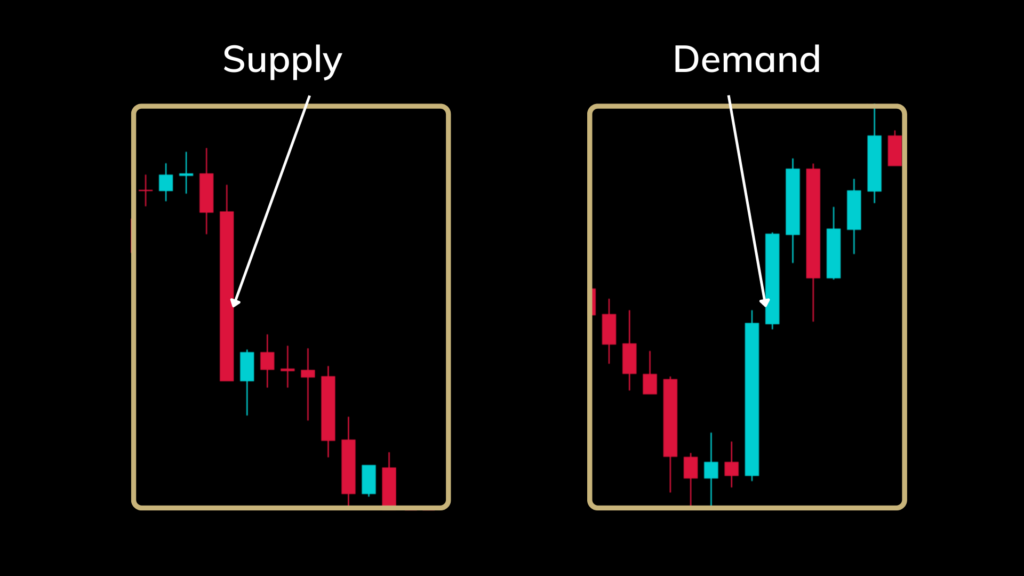
Identifying Supply and Demand Zones
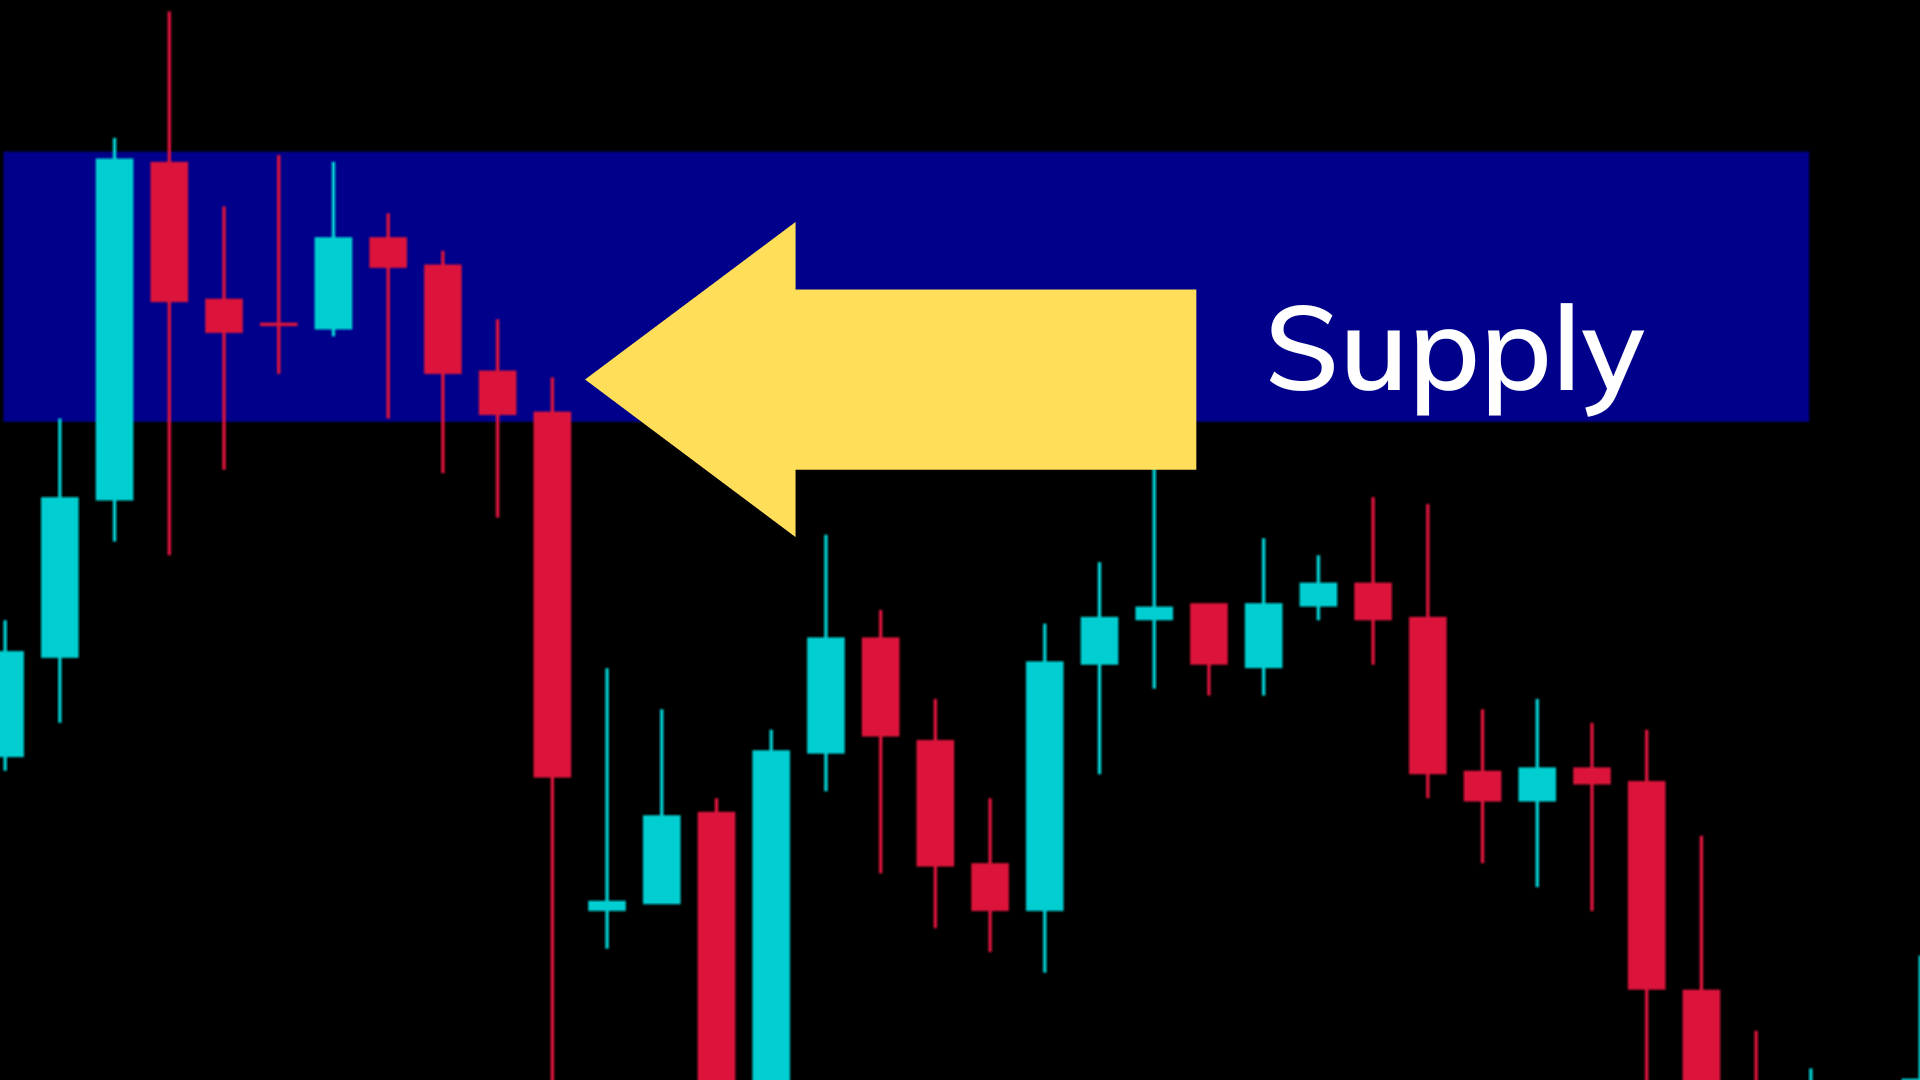
Now let’s talk about how to identify the supply and demand zones in your chart. To identify the supply or the demand zones you need to go to the first candle of the supply/demand and look for any consolidations. Let’s show you an example of this.
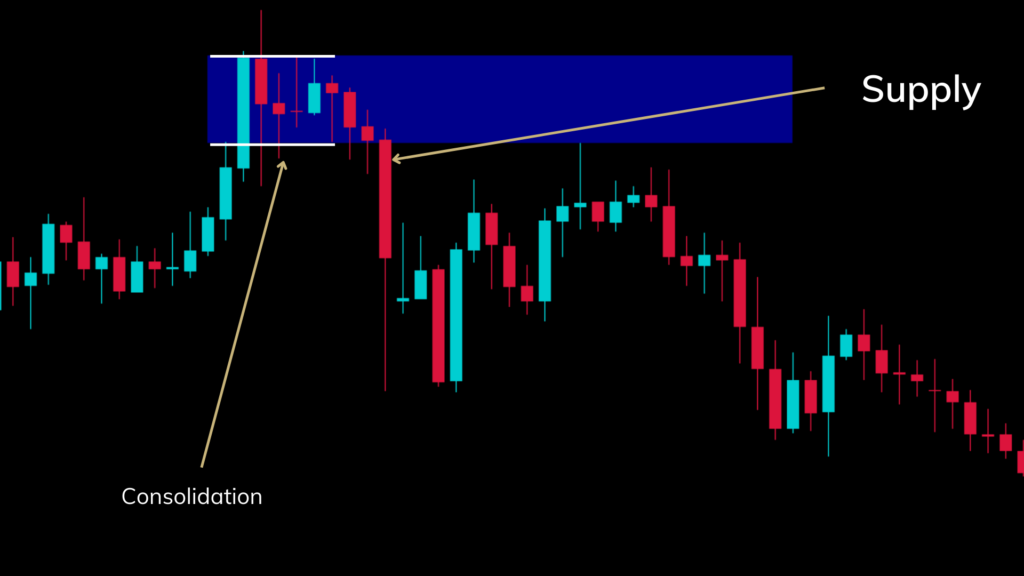
As you can see we have marked with an arrow where the supply is. If you look to the left of the supply you can see there is a consolidation before supply. Then we draw a rectangular box to cover the consolidation as seen in the above chart (the blue rectangular box). This is the supply zone. Now let’s look at another supply zone example.
As shown, there is consolidation before the high volume supply candle. This is a great place to draw the supply zone.
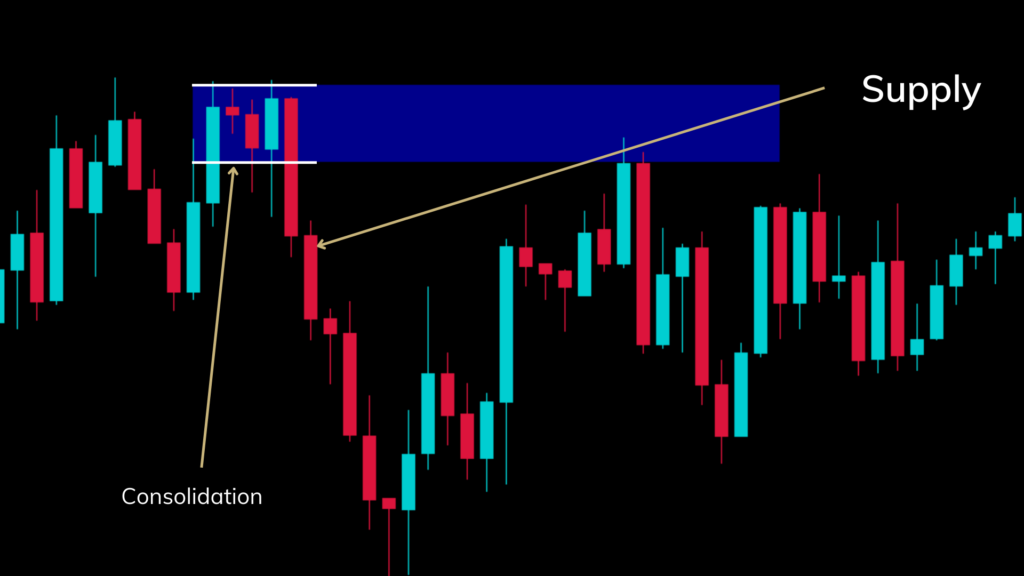
Now let’s look at an example of a demand zone. The following example shows a demand zone marked on the chart.
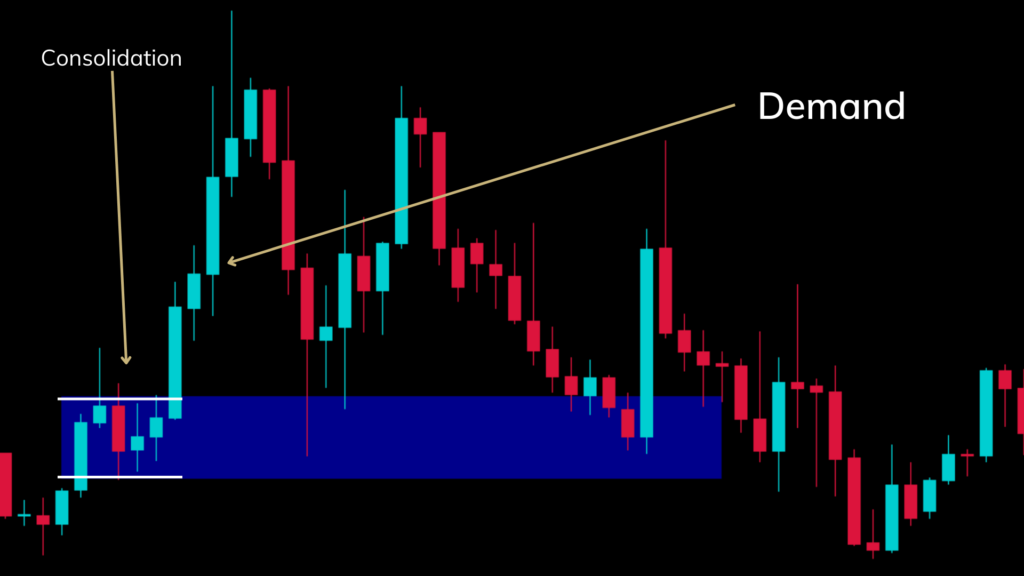
As you see from the above chart, there is a consolidation period before the high-volume demand candles appear. This is where you can draw the demand zone (drawn as the blue rectangle). We recommend you go to your forex chart and try to identify at least 10 different supply and demand zones. Remember to practice this if you like trading with supply and demand.
If you have reached this point in this guide, you know how to draw supply and demand zones. Now it’s time to talk about the supply and demand forex trading strategy.
The Supply and Demand Trading Strategy
Now let’s get into the supply and demand trading strategy. Let’s talk about the following example of supply that we looked at before.

As you see in the following chart the market pulls back to the supply zone and then goes down again. The supply zone is a great place to enter a trade when the market pulls back to it.
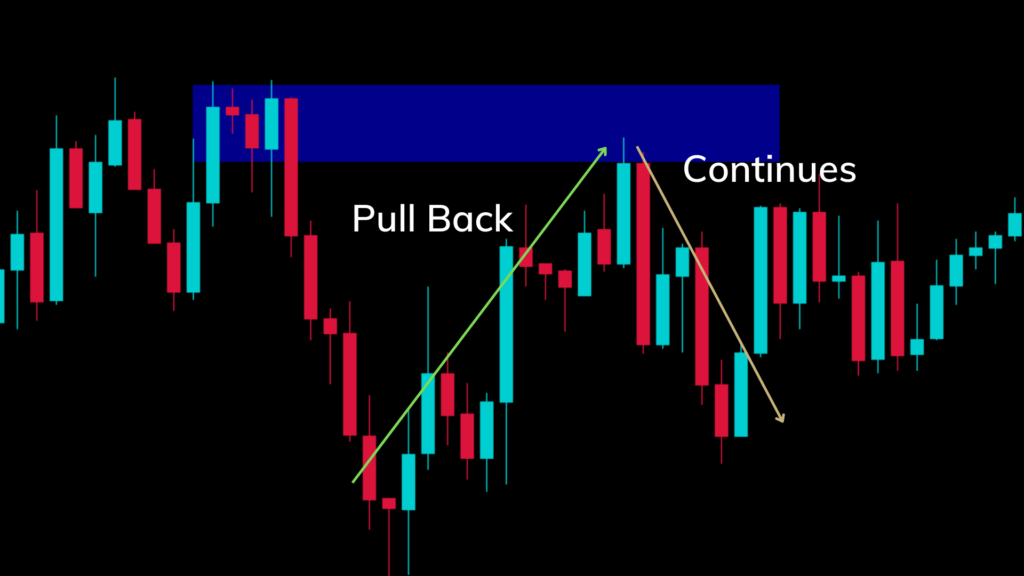
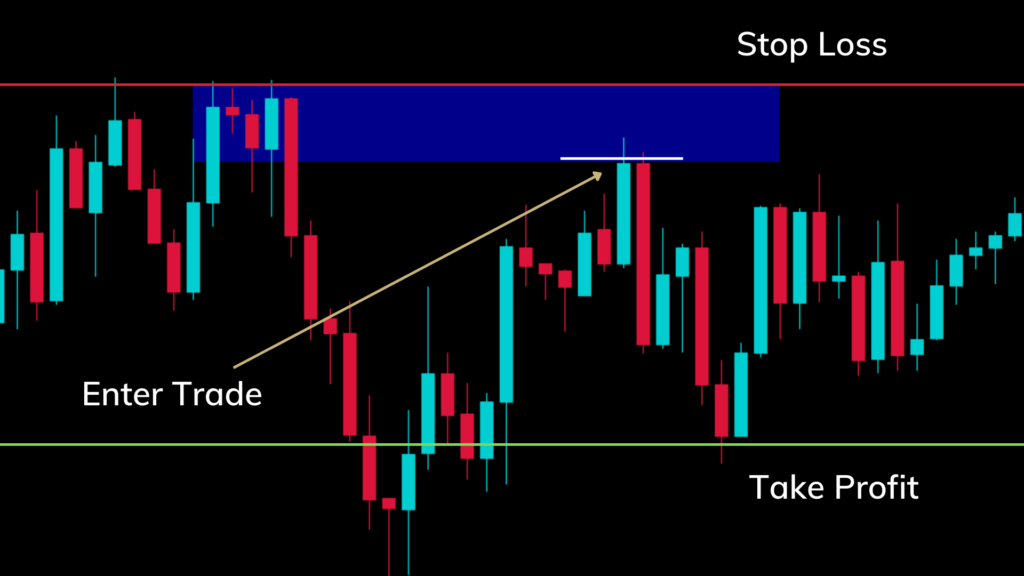
When the market pulls back and when the market starts forming a bearish candle you can enter a trade. The following chart shows the stop loss and the take profit placed. You can place the stop loss above the supply zone. Depending on the market and your risk management rules you can tighten the stop loss as well.
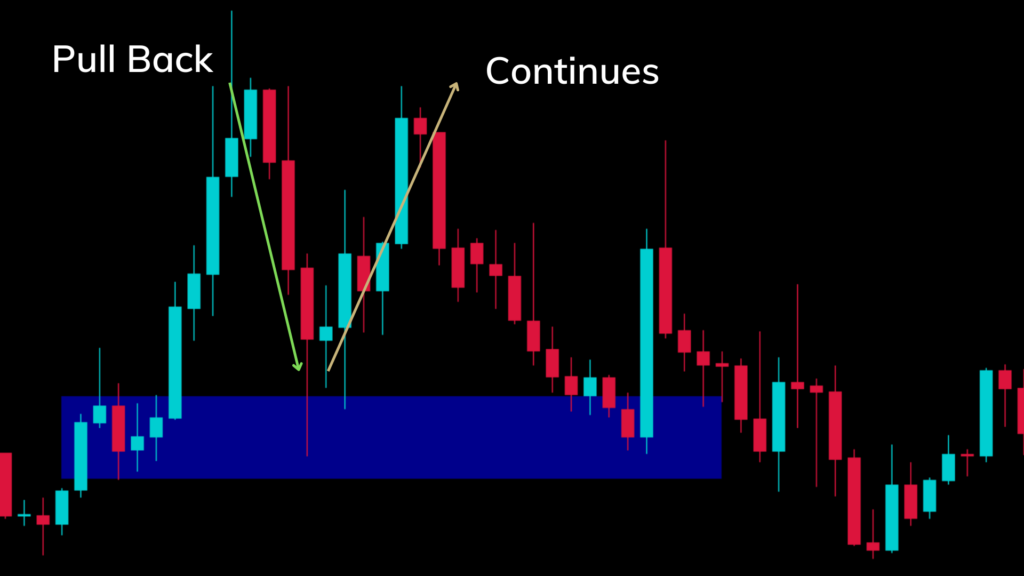
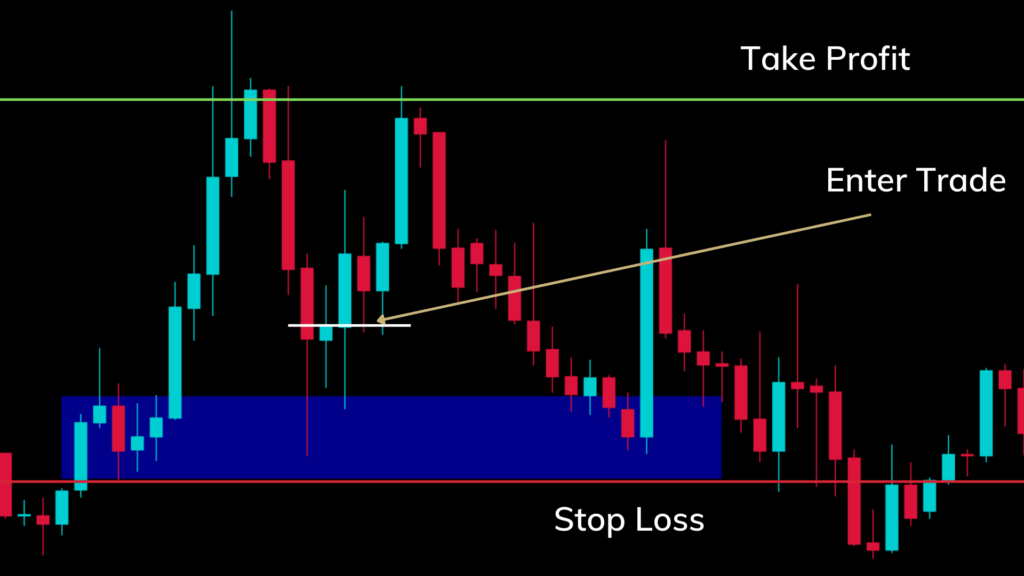
Now let’s look at another supply and demand example. As you can see from the following chart the market pulls back to the demand zone and then continues back up. You can place your stop loss and take profit based on your risk-to-reward ratio. Usually, the stop loss will be placed below the demand zone.
Final Thoughts
A supply and demand strategy is a great strategy to trade with. If you master the art of identifying supply and demand zones, you will be able to become a profitable trader. This strategy is not only suitable for swing traders, it can be great for both day traders and scalpers alike.

