In this guide, we will talk about Forex price action swing trading with Hull MA candlesticks. We will also talk about what Hull Moving Average (HMA) is and how to use the HMA to trade the forex markets.
What is the Hull Moving Average
The hull moving average was created by Alan Hull in 2005. In the past decade, the popularity of this moving average has exploded. It was created to minimize the lag of the traditional moving average (This is the biggest problem with the traditional moving average indicator).
The Hull moving average makes the traditional moving average more responsive while maintaining its smoothness. This doesn’t mean that the SMA or EMA is useless compared to the HMA. Since this guide is about the HMA, we will not discuss the SMA or the EMA.
How is Hull Moving Average Calculated
The hull moving average is calculated in several steps. First, we have to calculate a weighted moving average with period n/2 and then multiply it by 2. Then we need to calculate a weighted moving average for the period of n and subtract this from the one we previously calculated. Finally, we have to calculate a weighted moving average with a period of the square root of n using the data from the previous step. The formula is shown below
HMA = WMA(2*WMA(n/2)-WMA(n)),sqrt(n))
where, HMA = Hull Moving Average and WMA = Weighted Moving Average
Of course, you don’t need to know this calculation by heart, it’s just good to know how the HMA is calculated. What you really need to know is how to use the Hull moving average to trade the forex markets profitably. Now let’s get into it.
How to Use the Hull Moving Average
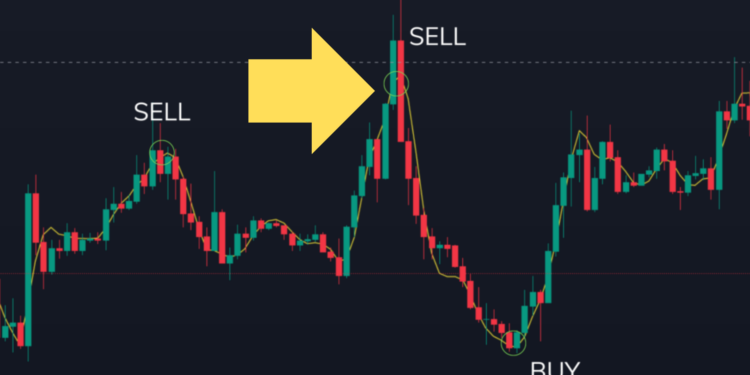
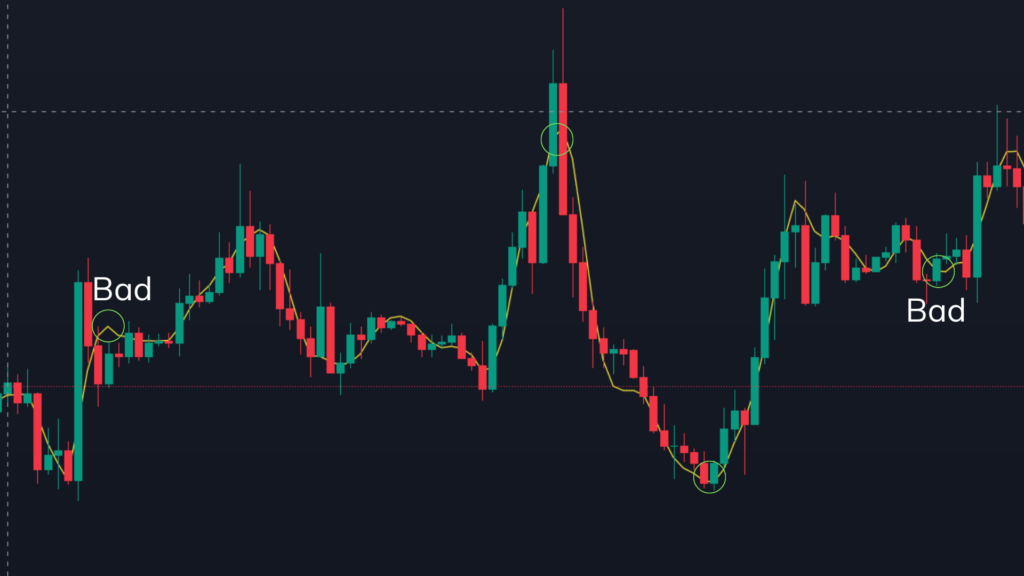
There are several ways to use the Hull Moving Average. It is very important to choose the right period for the Hull Moving Average. A common way to use the Hull moving average is to identify the turning points. A simple strategy that you can use with the HMA is to buy when the HMA turns up and sell when the HMA turns down. The chart below demonstrates this with a HMA of period 9.
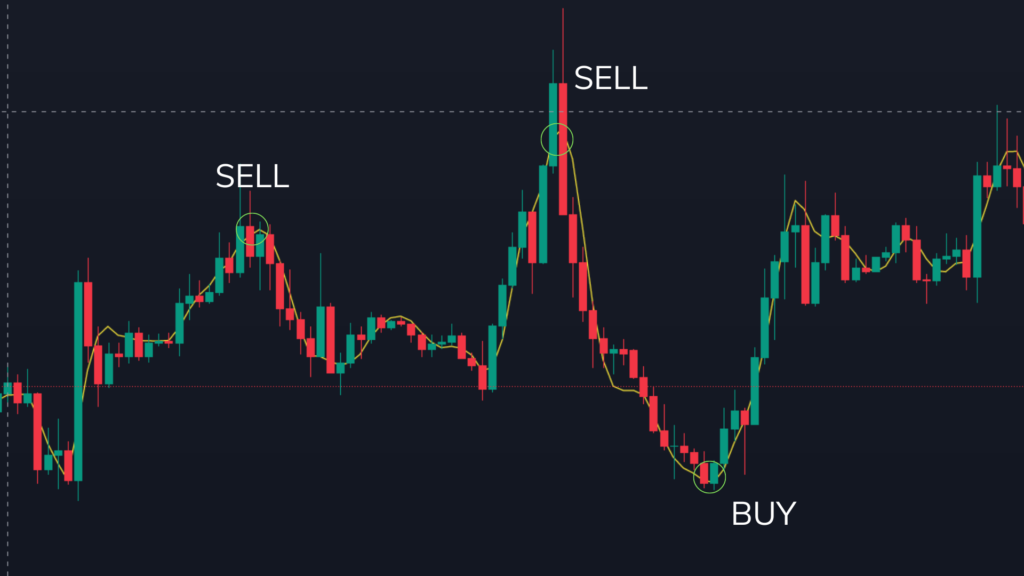
As you can see from the chart you can get great buy or sell signals with HMA. But this is not always true, some signals can be bad signals as shown below. This means that this is not the ideal way to trade using the hull moving average. But if you combine the hull moving average with price action you can create a good forex trading strategy. We will look at this in the next section.
Swing Trading with Hull Moving Average (Price Action)
We will talk about multiple strategies to trade using the HMA and price action. This strategies involve using the HMA with price action trading to give multiple confirmations of a reversal. This can give you confidence when entering a trade.
Supply and Demand + Hull Moving Average
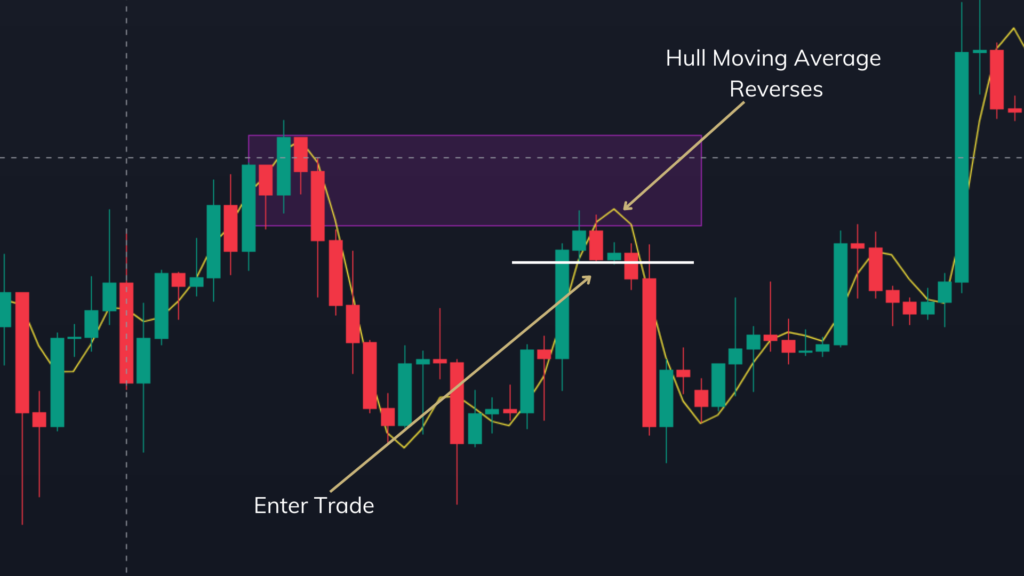
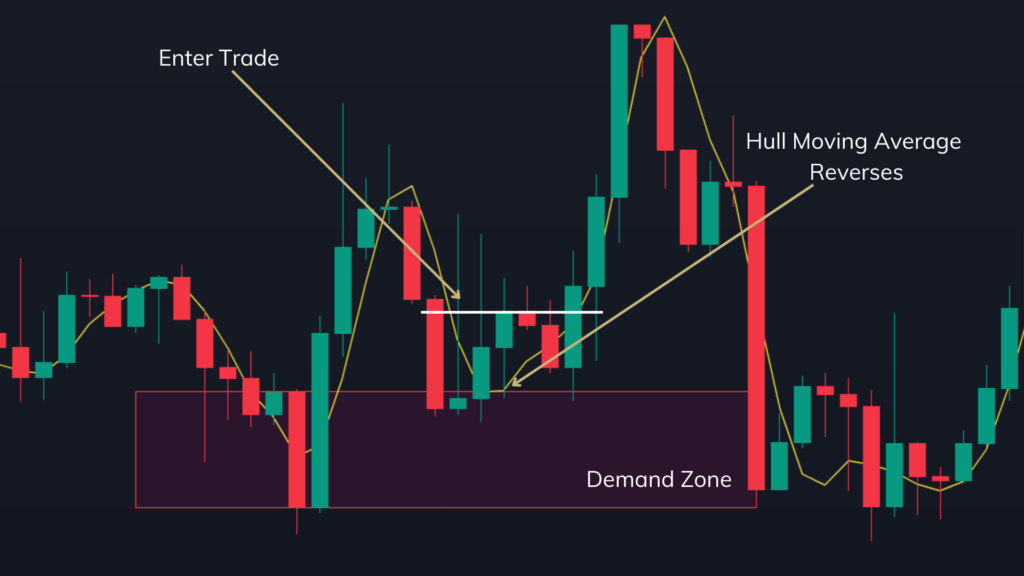
Supply and demand are one of our favorite ways to trade. This trading strategy revolves around taking the reversal near the supply or demand zone. With the HMA this reversal can be further confirmed. Also, we will be using the HMA to find trade entry points near the supply or demand zones.
The chart below shows the supply and demand zone and the HMA in a single 4-hour chart.
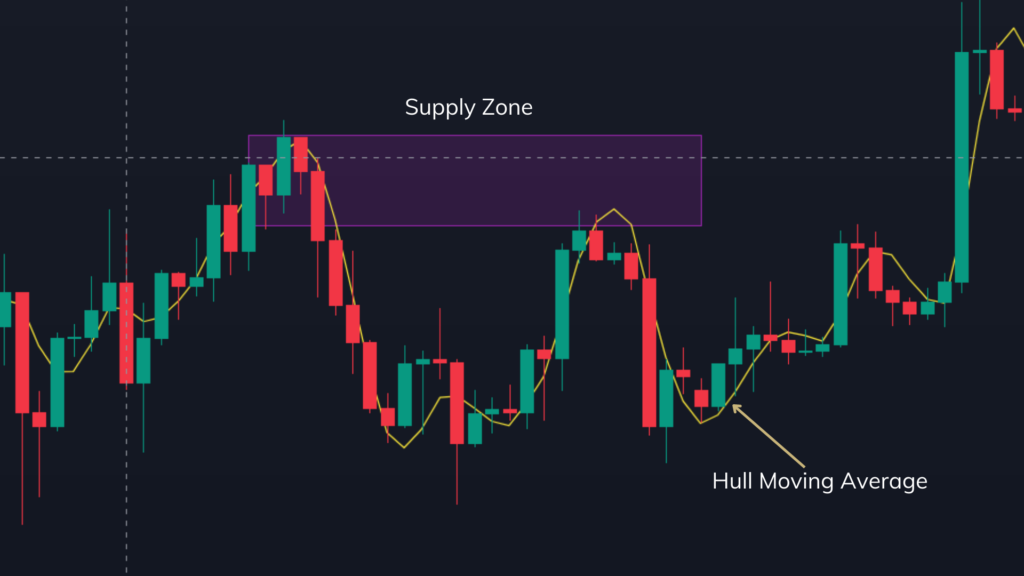
As you can see the market and the HMA reversed when they reached the supply zone. The HMA confirms a reversal and when the HMA reverses its direction, this becomes a good entry point for trade as shown below.
Now let’s look at another example of this strategy with a demand zone. As you can see the HMA reverses when the market hits the demand zone. This is a good place to enter a long trade as shown.
Channel Reversals + Hull Moving Average
In this trading strategy, we will be using the Channels + Hull Moving Average. The HMA will be mainly used to find the entry point when the market reverses near the support or resistance of a channel. The following example shows a EURUSD Channel in the 4-hour chart.
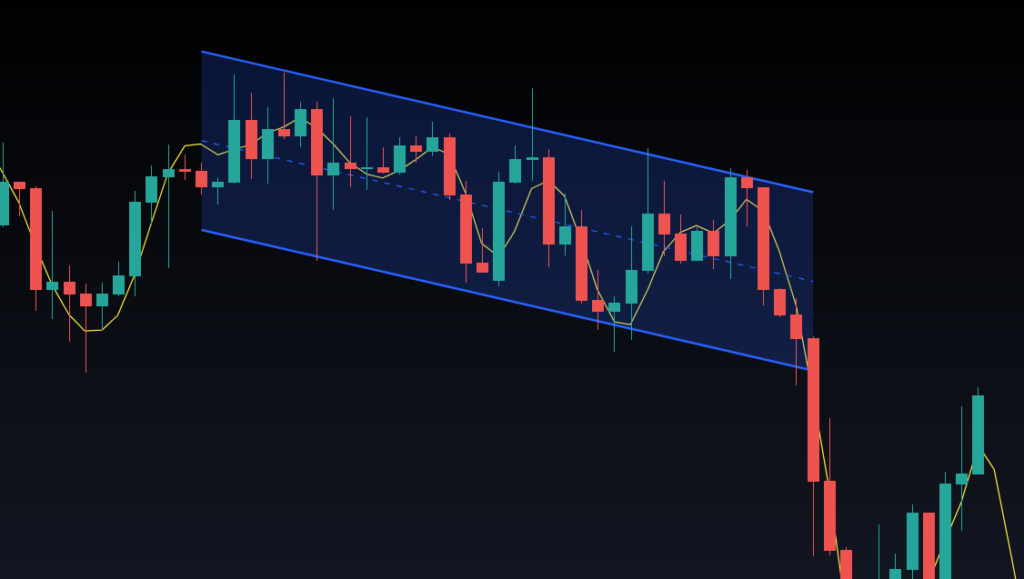
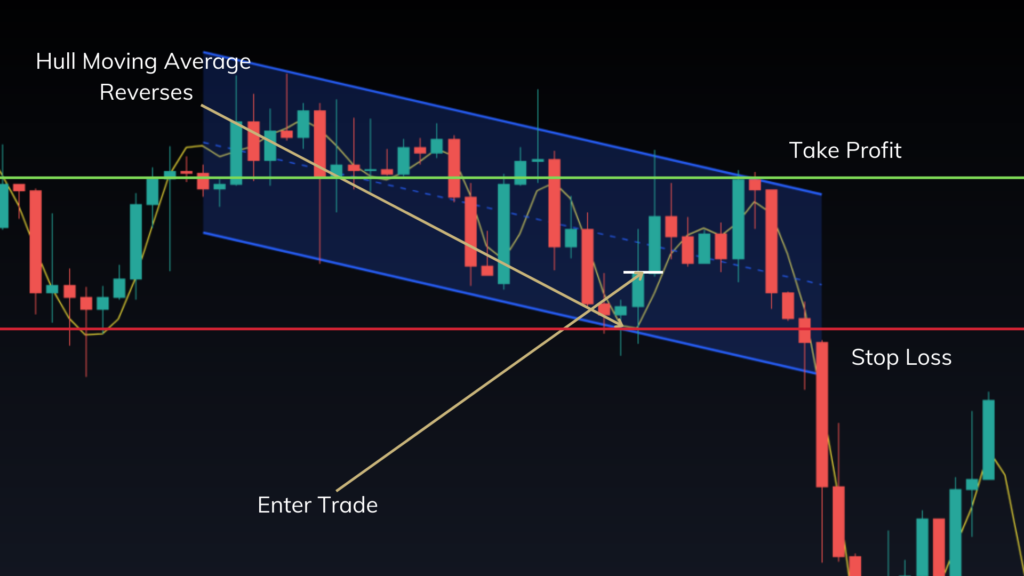
As you can see in the chart below the market touches support for the third time in the downward channel. After the market touches the support the market direction changes and the hull moving average direction changes as well. When the HMA changes its direction this becomes a good entry point for a trade. This is shown in the following chart. Also, remember to always wait till the candlestick is finished forming before entering the trade when the Hull MA reverses.
Using HMA for Maximizing Profits
Another great use for the HMA is to use it as a trailing stop loss to maximize profits. For this, we will be using a Hull MA of period 20. The chart below shows an HMA of a period of 20 added.
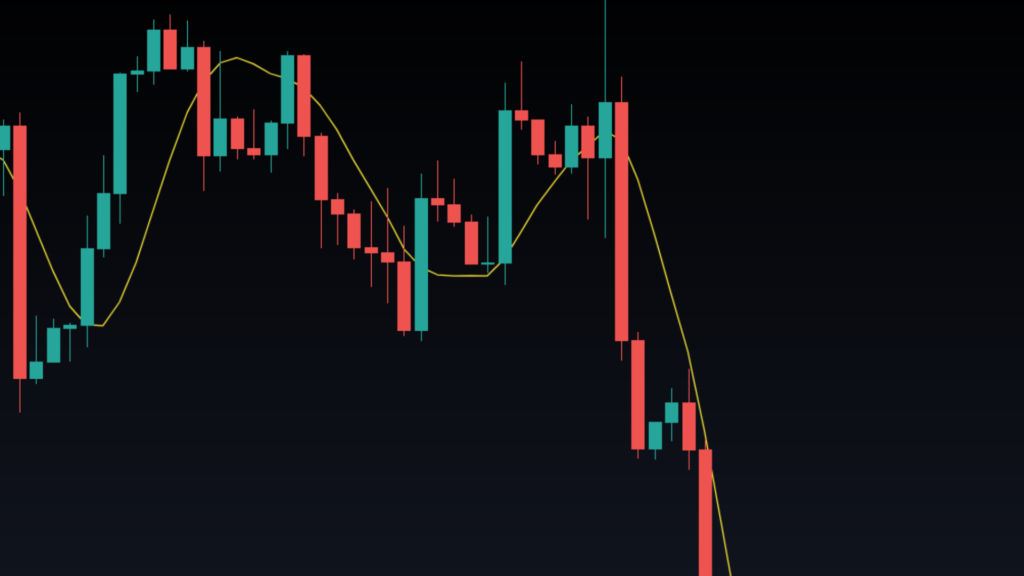
The following chart shows a breakout of a small consolidation. After the breakout, the markets pull back and then form a bearish candlestick pattern. This is a good time to enter the trade.
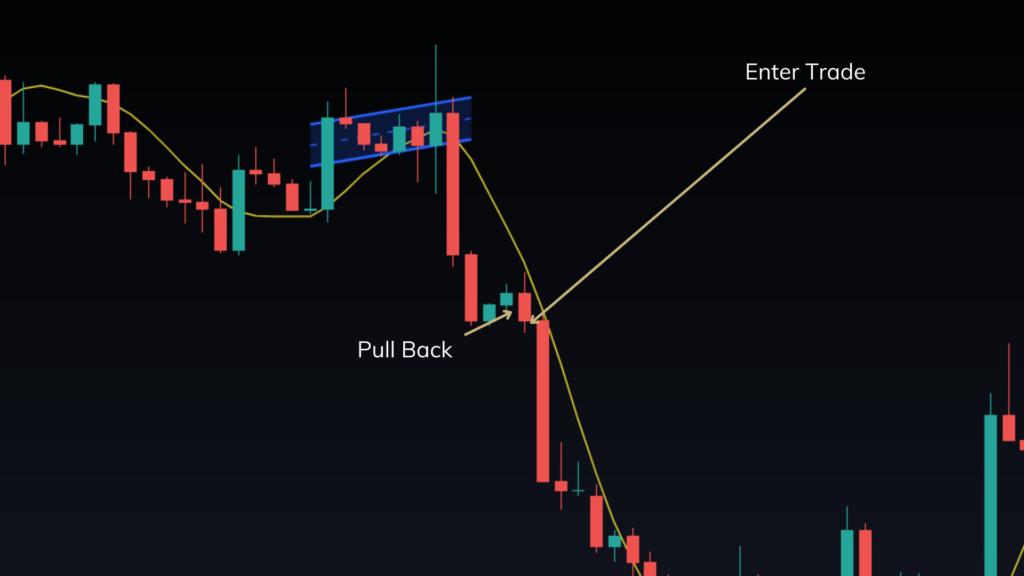
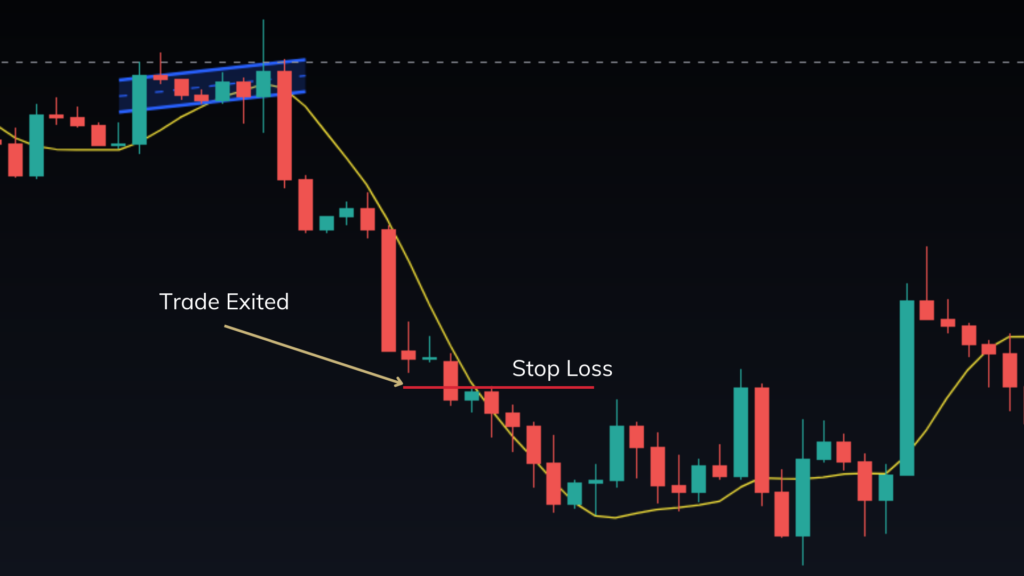
The key to using the HMA in this situation is to use it as a trailing stop loss. That means you will be placing your stop loss above the HMA as shown below.
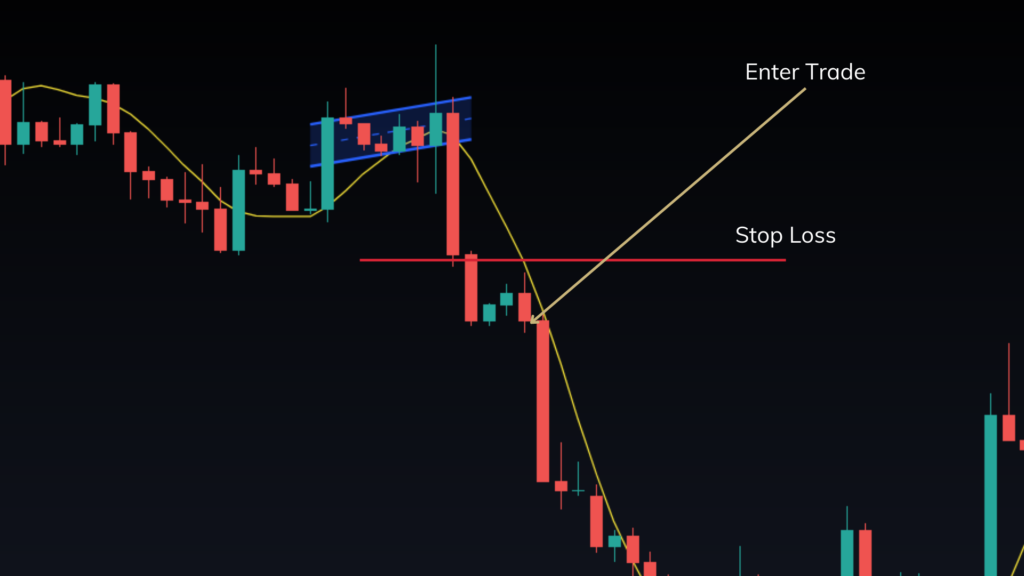
Then you can slowly move the stop loss (still keeping it above the HMA) until the market reverses and stop you out of the trade. This way, you can maximize your profitability in a single trade. The chart below demonstrates how you can do this.
Conclusion
HMA is an improvement over the traditional SMA and EMA. The HMA can be quite useful when determining the trend direction. As we discussed previously you can combine the HMA with some price action strategies such as supply & demand and trading reversals within a channel.
Also, you can use the HMA as a trailing stop loss to maximize your profits in the forex market. We recommend you take this strategy and practice them by backtesting. If you are not sure how to back-test, check out this guide. If you are interested in learning more about trading check out our complete guide to learning how to trade Forex.

