In this article, we will talk about whether you can use Fibonacci retracements for day trading forex. We will also talk in detail about how to trade using Fibonacci retracements.
Yes, you can use Fibonacci for day trading forex. It can be used to find entry points and even exit points for your trades when day trading forex. Most day traders use Fibonacci levels as resistance and support lines. We can also use the Fibonacci levels in combination with other trading strategies to confirm reversals in the forex market.
First, before we look at how to trade using Fibonacci, let’s look at what Fibonacci retracements are and what these Fibonacci retracements are based on.
What is Fibonacci Retracements

The Fibonacci retracements are based on the Fibonacci sequence. Many people claim the Fibonacci sequence is nature’s secret code. You can see this sequence occurring in nature, for example in flowers and hurricanes.
The Fibonacci sequence is based on something called the golden ratio. The Fibonacci sequence starts with zero and then continues by adding the previous two numbers to get the next number. The following sequence of numbers shows the Fibonacci sequence. As you can see the 3rd number is obtained by adding the first two numbers 0 & 1. The fourth number is obtained by adding the previous two numbers as well.
0, 1, 1, 2, 3, 5, 8, 13, 21, 34, 55, 89….
Each of the Fibonacci levels is associated with a percentage. These percentages are derived from the Fibonacci sequence. The most common Fibonacci retracement level percentages are;
- 0%
- 23.6%
- 38.2%
- 61.8%
- 100%
These percentages are calculated by dividing numbers. When you divide two numbers further in the sequence which are next to each other you get, 0.618 (61.8%). For example, 55/89 = 0.618. You get 38.2% (0.382) when you divide one number by the second number to its right side, for example, 34/89 = 0.382. Then to get the number 0.236, you need to divide a number by the third number to its right side, for example, 21/89 = 0.236. Traders also use the level at 50% even though it is not a Fibonacci level.
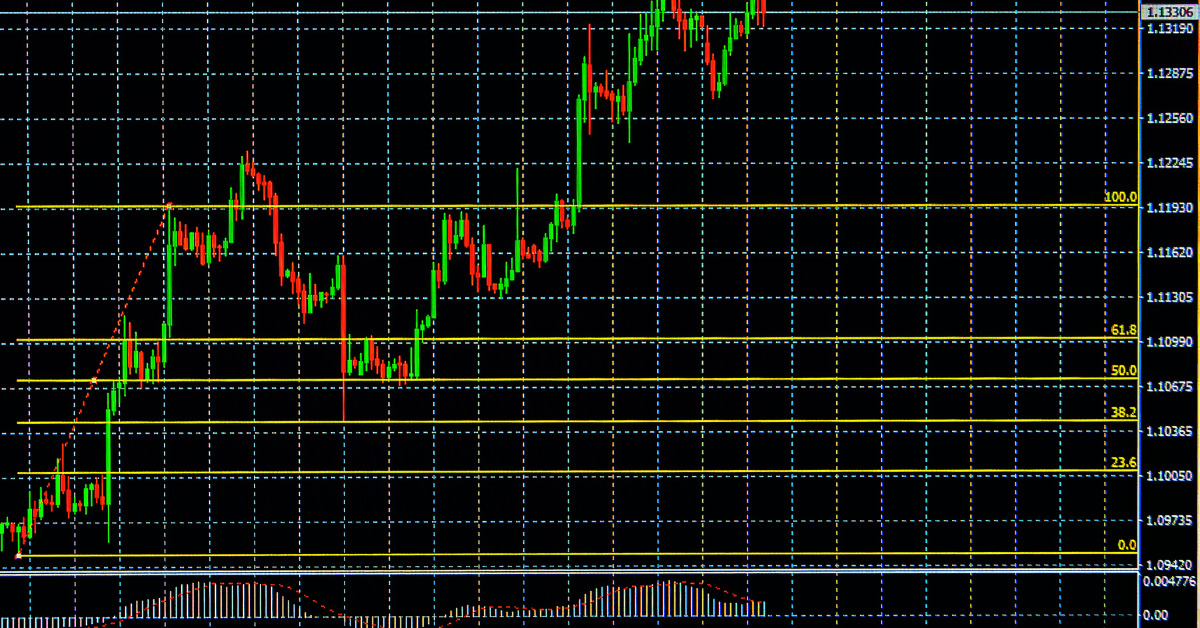
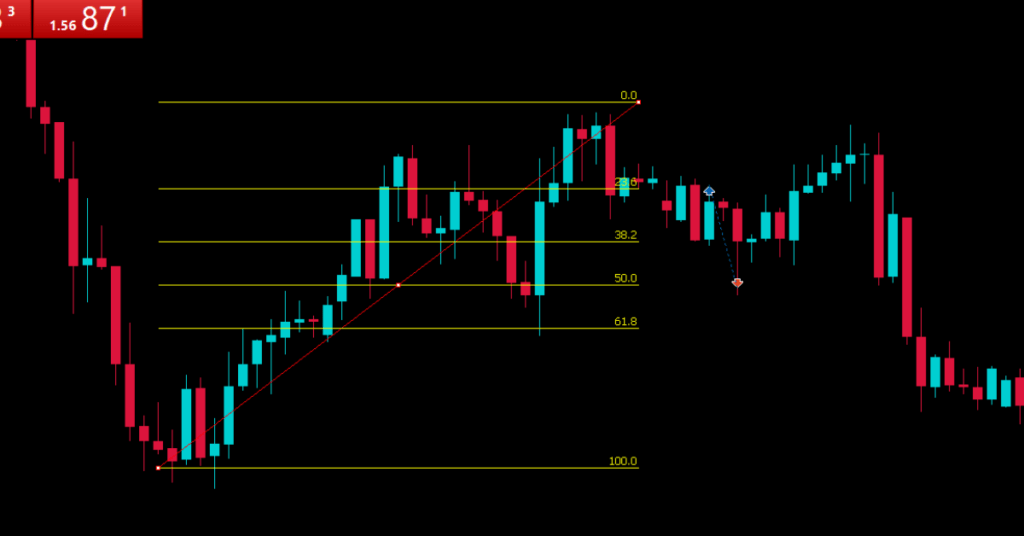
Below (Figure 1) shows the Fibonacci retracement levels drawn on the Forex chart. Later we will talk about how to draw the Fibonacci retracement levels properly and how to trade using the Fibonacci retracement levels.
What is day trading?
Day trading is a style of trading where a trader does not hold trades overnight. A day trader usually takes 1-5 trades a day. If you take more traders per day you are likely to be a scalper than a day trader.
There are totally 4 different trading styles which are scalping, day trading, swing trading, and position trading. The Fibonacci trading strategy that we will talk about in the next section does not only work for day trading. It can be used for both scalping and swing trading as well.
How to Use Fibonacci for Day Trading
Now let’s talk about how to use Fibonacci retracement for day trading, In the following trading strategy will be using the Fibonacci levels as support and resistance levels. We will be using these levels to see how far the market will retrace before it continues in the desired direction.
The Fibonacci percentages that will be used are 0.0%, 23.6%, 38.2%, 50%, 61.8%, and 100%. Some traders use other percentages as well, but for this strategy, we will only be looking at these particular percentages.
To make better entry-point trading decisions, we will be combining Fibonacci levels with the supply and demand strategy. Now, let’s look at how to use the Fibonacci retracement for finding the reversals and retracements.
The following figure shows the Fibonacci levels drawn on the chart in MetaTrader 5 trading platform. MetaTrader 5 trading platform is one of our favorite trading platform, we recommend you download & install it to follow along with this guide. We recommend you get the MetaTrader 5 trading platform with a recommended broker like BlackBull Markets.
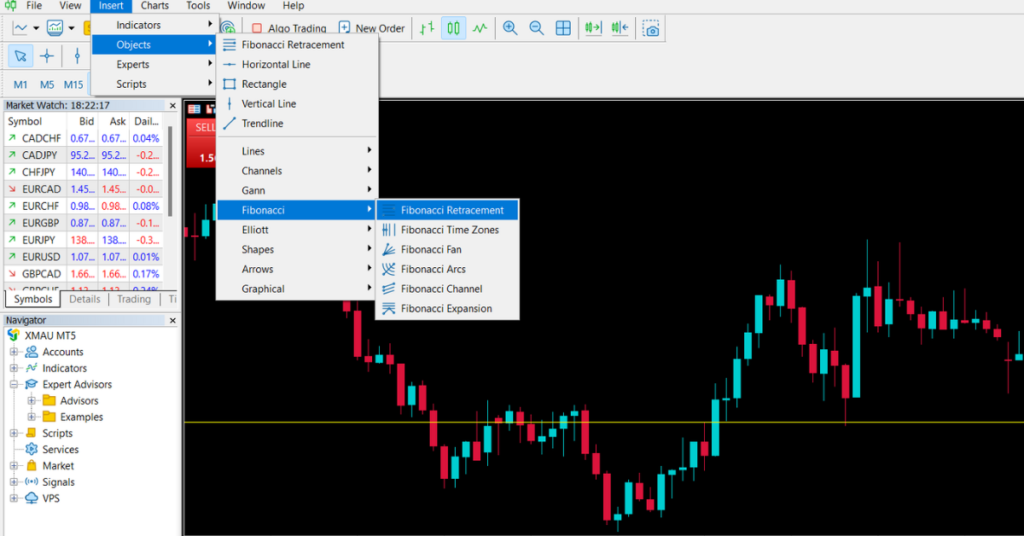
Now let’s look at how to draw the Fibonacci levels in MetaTrader 5 platform. To add the Fibonacci retracement in MT5, go to insert -> objects-> Fibonacci and then select Fibonacci retracement as shown in the figure below (Figure 2).
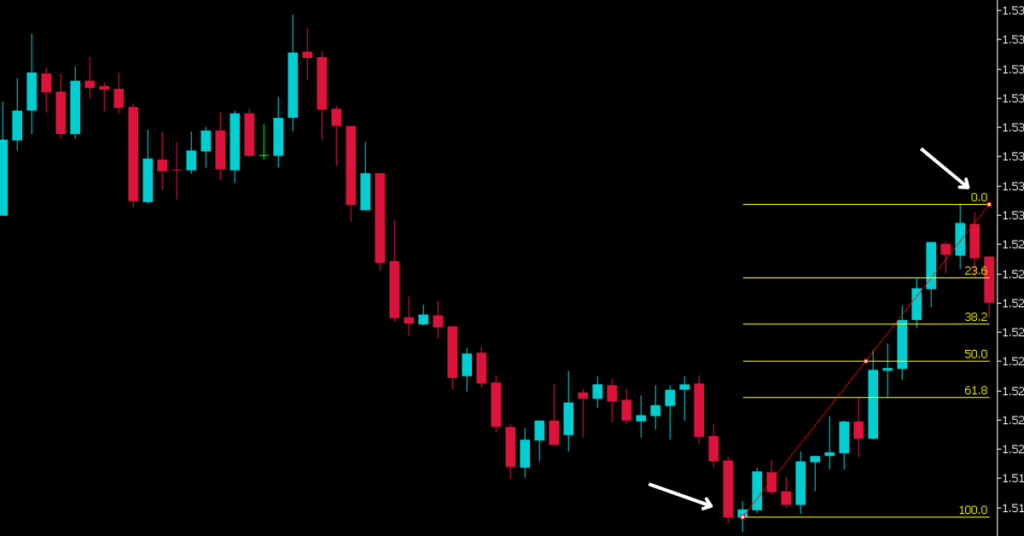
Then draw it from the lowest point to the highest point in a minor trend in the forex chart as shown in Figure down below (Figure 3).
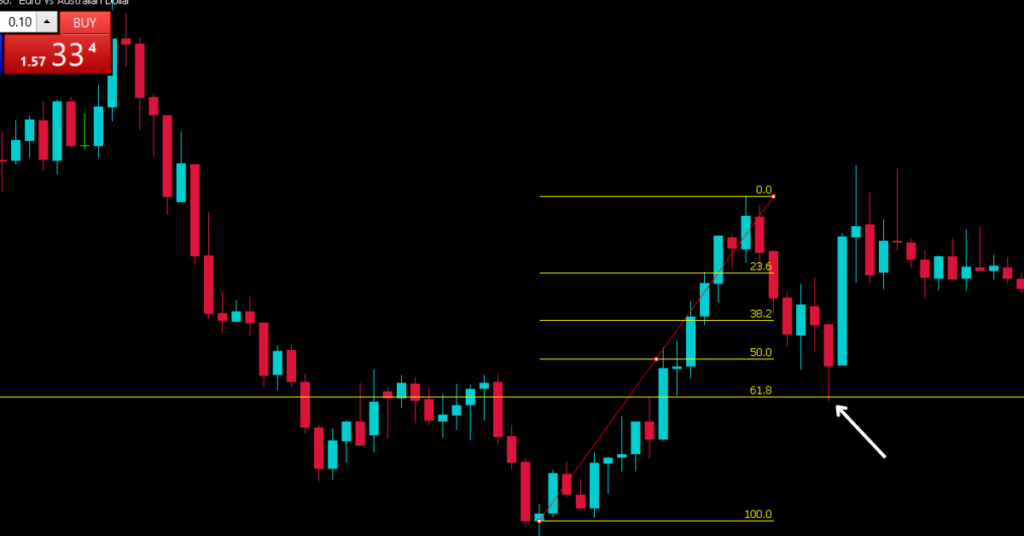
Next, we will be looking for the level to which the market retraces. This is shown in Figure 4 (figure below). As you can see from Figure 4 the market comes to the 61.8% level and then bounces back. But, the question now becomes, how do you know that it will bounce back at that particular level?
For this, we need another way to confirm this. That’s why we will also use the supply and demand strategy to confirm this. It is important to note that this is not the only way to confirm this, you can also use other strategies or trading indicators.
The supply and demand strategy is based on supply and demand zones. A supply zone is a zone where aggressive selling happens and a demand zone is where aggressive buying happens.
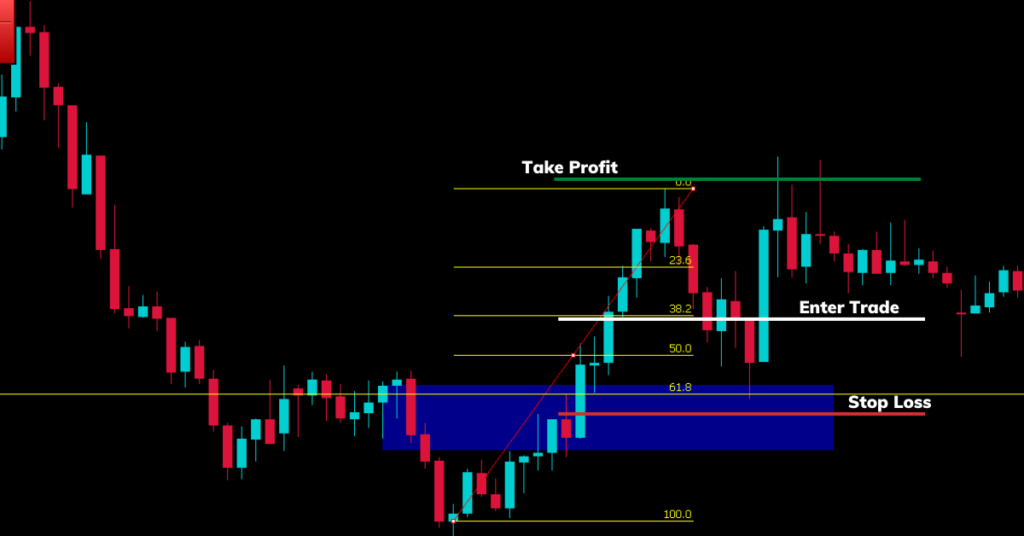
As you can see from Figure 5, the area highlighted in blue is the demand zone. This is where aggressive buying starts to occur. This is represented by a series of green (bullish) candles. We have marked with the blue rectangle where this buying started.
With the supply and demand strategy, we expect the market to pull back to the demand zone (in this case) and then reverse its direction. This is shown in Figure 5. As you can see, this is also where the 61.8% Fibonacci level is at. For the combined strategy to work, the supply/demand zone should be at a Fibonacci level. This gives you great confidence in a reversal.
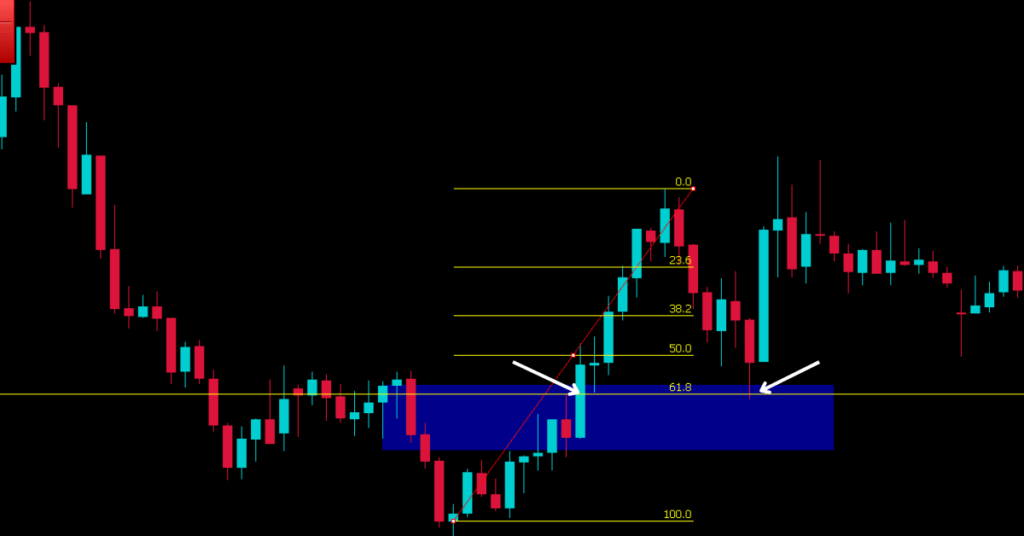
You could enter a trade after the rejection candle (rejection from the demand level & 61.8% Fibonacci level) is completely formed. You could place your stop loss depending on your risk-to-reward ratio. This is shown in the figure below (Figure 6).
Conclusion
In this article, we talked about in detail how to use Fibonacci for day trading forex. We also discussed in detail what Fibonacci is and how to confirm your Fibonacci retracements using the supply and demand trading strategy.

