In this article we will talk about whether can you trade forex without indicators. We will also talk about forex trading strategies that you can trade with today, without using any technical indicator.
Yes, you can trade without indicators using price action. In fact, we prefer trading with price action with minimal indicators. There are a lot of profitable traders out there who trade without any indicators. If you are interested in learning how to trade Forex without indicators keep on reading.
How to Trade Without Indicators
If you are new to trading, there are basically three ways to trade in the Forex Markets. That is by using fundamental analysis, technical analysis, or sentiment analysis. Fundamental analysis is pretty much trading with the news. We personally do not recommend this type of trading. It is in fact a good idea to be aware of the news but not a good idea to trade based on the news.
Another way to trade is using sentiment analysis. This type of trading is done by understanding the general feel of the market by listening to what the trading community says. We personally avoid this type of trading completely. This is mainly because of the statistic that says more than 95% of the traders fail. This means we should kind of do the opposite of what the majority of the traders do if we want to be successful forex traders.
The best way to trade forex is to use technical analysis. This is done by analyzing the Forex charts. There are two main ways to do technical analysis. These are using technical indicators or price action. Yes, you can use both as well.
The way to trade without using indicators is to trade with something called “Price action”. You can also trade without using technical indicators by using fundamental analysis or sentiment analysis. But as discussed earlier, using fundamentals or sentiments is not the best way to trade. Also, an interesting thing to note is that most of the fundamentals are reflected in the forex chart, therefore you don’t have to check the news that often.
What is Price Action?
Price action is a way of trading using the bare charts. With Price action, you will be looking for certain patterns such as triangles, wedges, pennants, or different candlesticks such as shooting star, hammer, etc. You don’t need to know all these patterns by the names but it’s good to understand how these patterns work.
Let’s look at a few of the chart patterns/ candlestick patterns briefly. The following chart shows a symmetrical triangle formed in the charts.
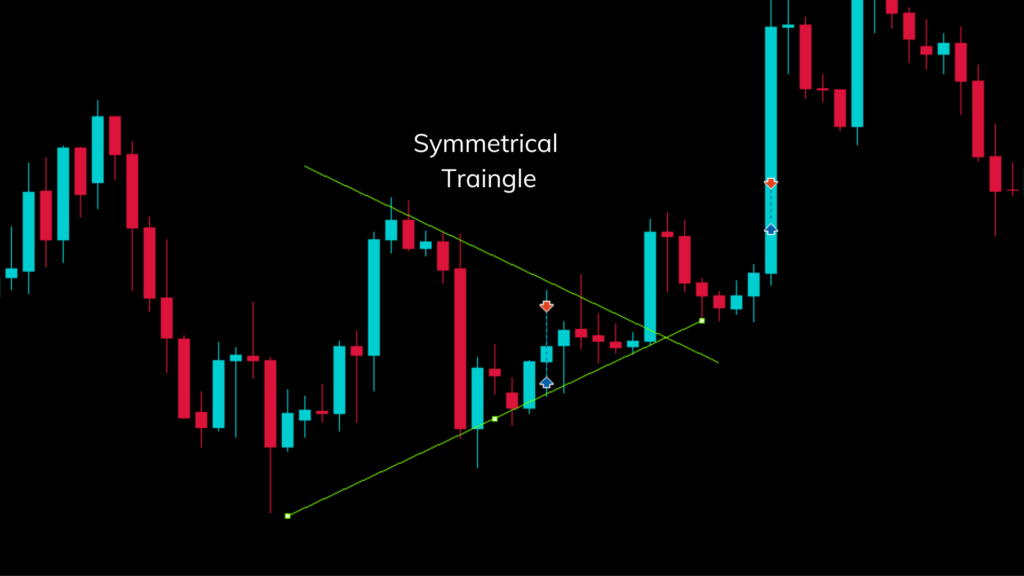
This pattern is formed when the market consolidates forming a symmetrical triangle. There are two other types of triangles called the ascending triangle and descending triangle. If you want to learn more about different chart patterns check out this guide.
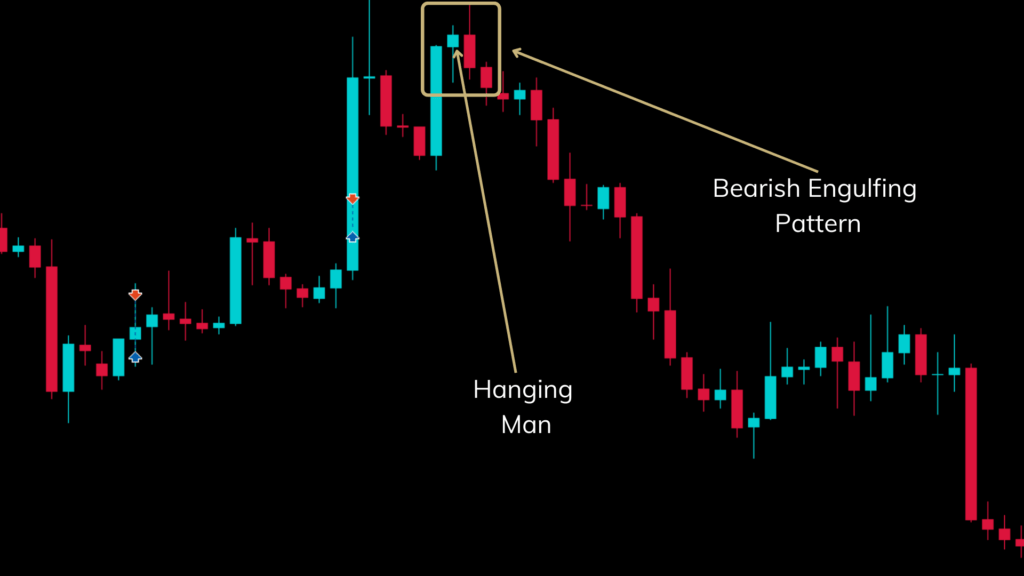
The chart above shows a single candlestick pattern called the Hanging man and a double candlestick pattern called the bearish engulfing pattern. Both of these candlestick patterns are reversal patterns.
This means the market is likely to reverse if these candlestick patterns are formed. For both of these patterns to be applicable the market must be in an uptrend. If both of these candlesticks are formed at the same time, it’s a strong indicator of a reversal. If you are interested in learning more about these candlestick patterns check out this guide.
Price Action Strategies
There are several effective price action trading strategies that you can use without any technical indicator. A few of our favorite price action strategies are reversal trading strategy, breakout strategy, and supply & demand trading strategy. You can use all these strategies in conjunction with each other as well. Now let’s discuss these forex trading strategies.
Strategies for Trading Without Indicators
In this section, we will talk about some effective price action strategies that you can use to trade without indicators in detail.
Reversal Trading Strategy
Trading reversals is a great strategy. Learning how to trade reversals properly will make a you great trader. There are reversals happening in the markets most of the time. But it is extremely important to identify what reversals to trade and what to avoid. (Because some reversals can be false reversals)
There are plenty of ways to trade reversals. You can trade reversals within a channel or you can trade reversals without any channel. We will talk about both ways to trade reversals. First, we’ll look at how to trade reversals without a channel.
Trading Reversals Without Channels
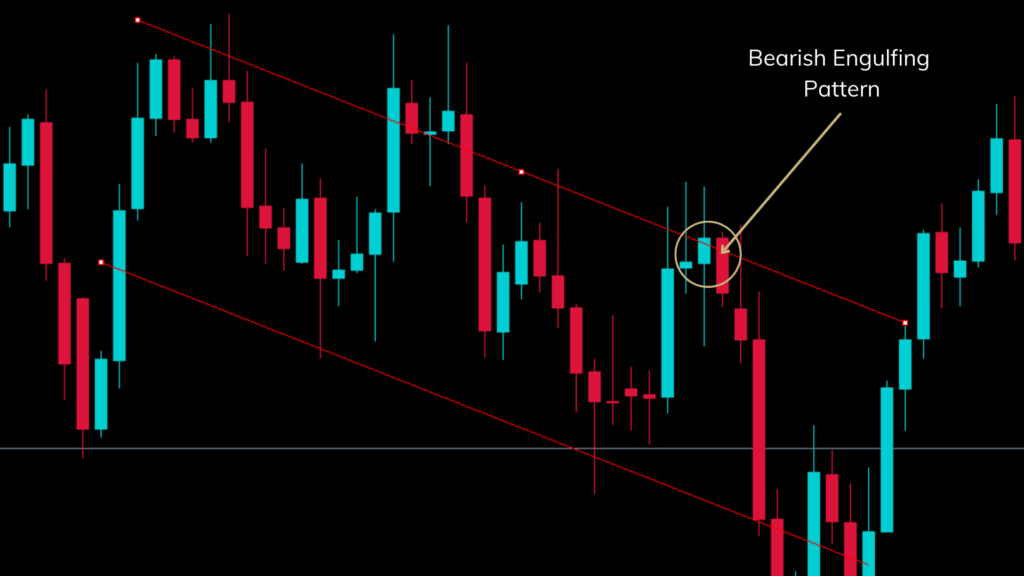
A nice and easy way to trade reversals is using double/single candlestick patterns. This doesn’t always work but you can make it work by identifying the major zones. Take the following double candlestick pattern for example (Bearish Engulfing Pattern).
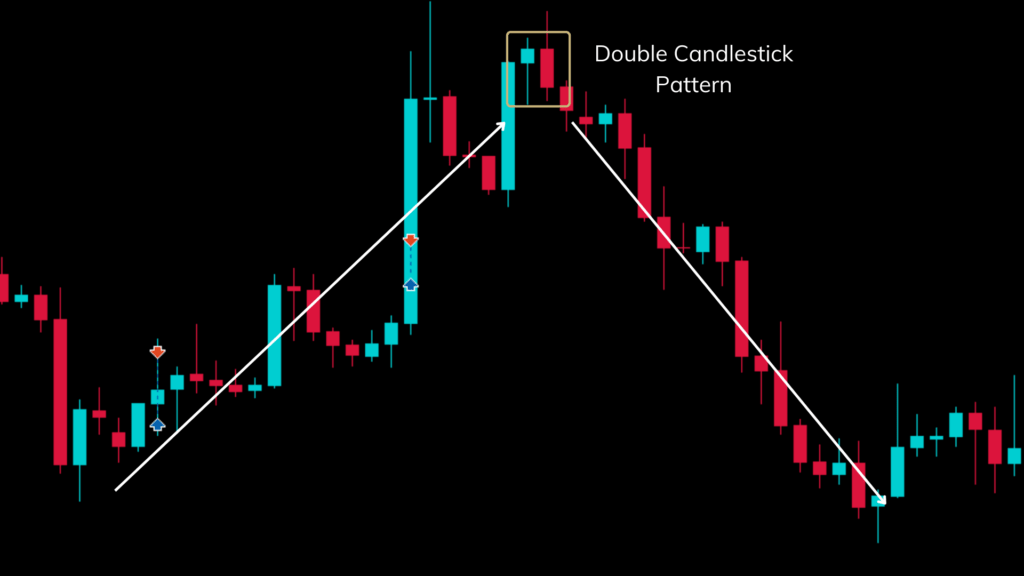
As you can see the market reversed when the bearish engulfing pattern is formed. This is true most of the time but the reversal might not be for that long most of the time. How do you know if a bearish engulfing pattern formed is a good entry point for a trade? Look for major zones/Key levels.
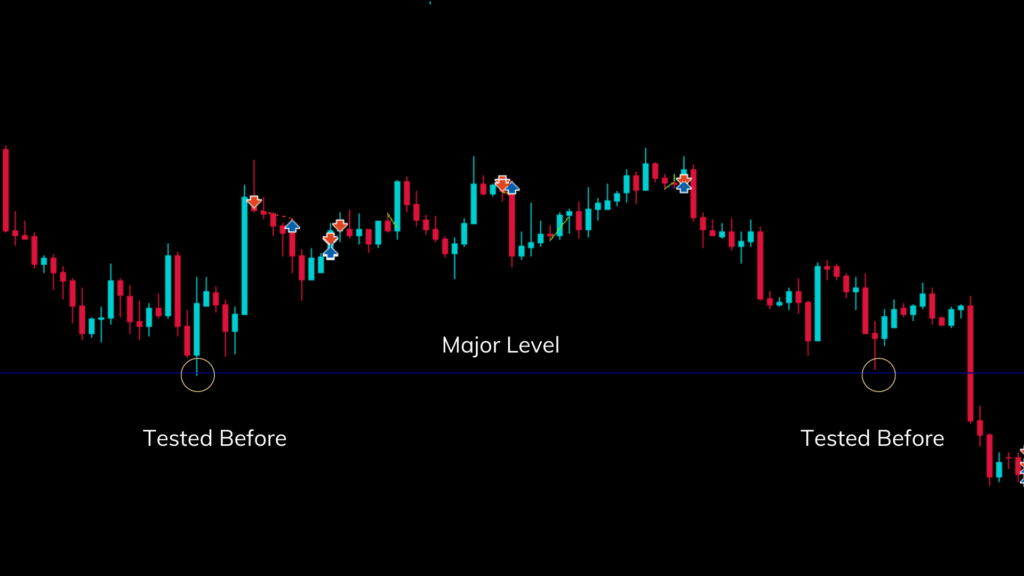
This is simply seeing if the level is being tested before as shown in the chart below. You can also go back in the chart to see if this level is further tested.
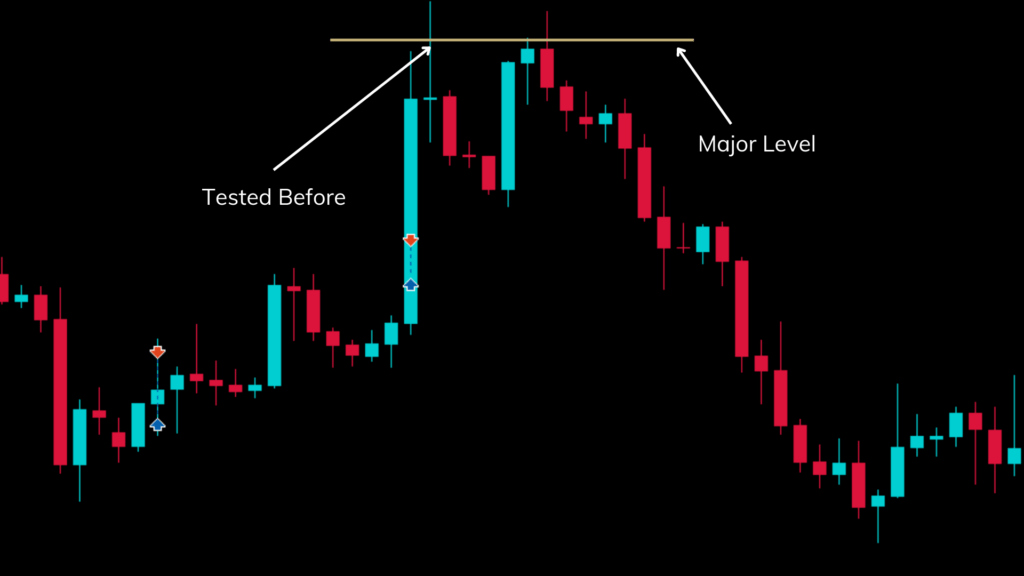
The chart below shows that this major level is tested before. This key level used a be a good support, but now turned into resistance.
Trading Reversals With a Channel
Trading reversals within a channel is another great way to trade. The following chart shows a down channel. To enter a reversal within the channel, it is a good idea to wait till the market touches the support or resistance of the channel at least 3 times.
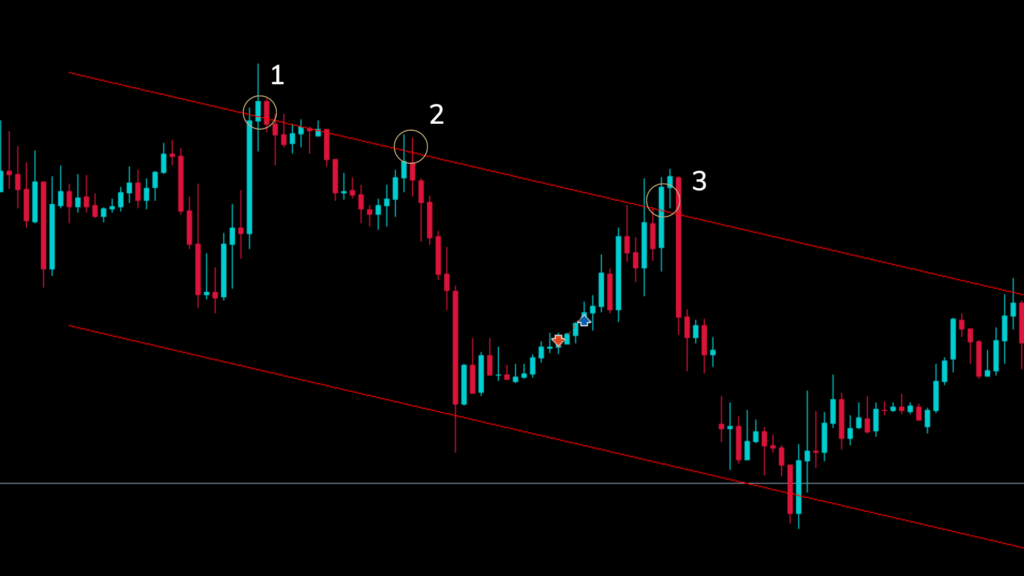
As you can see, you can enter the trade when the market touches the resistance of the channel for the third time. But always wait till a good bearish candle is formed before entering a trade. The following example shows a bearish engulfing pattern formed at the third touch of the resistance of the downward channel. This is a good place to enter the trade. You can exit the trade at the support.
Breakout Trading Strategy
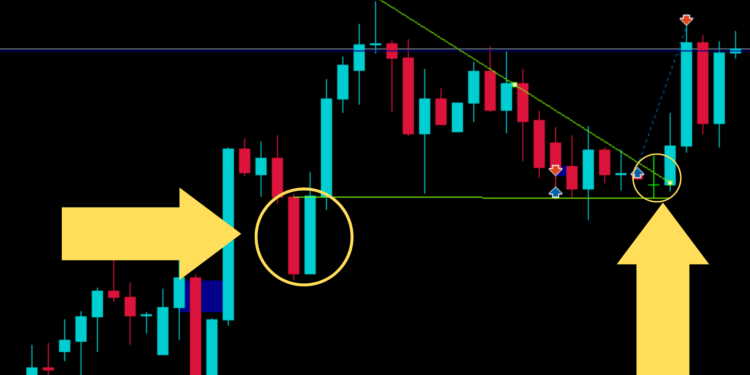
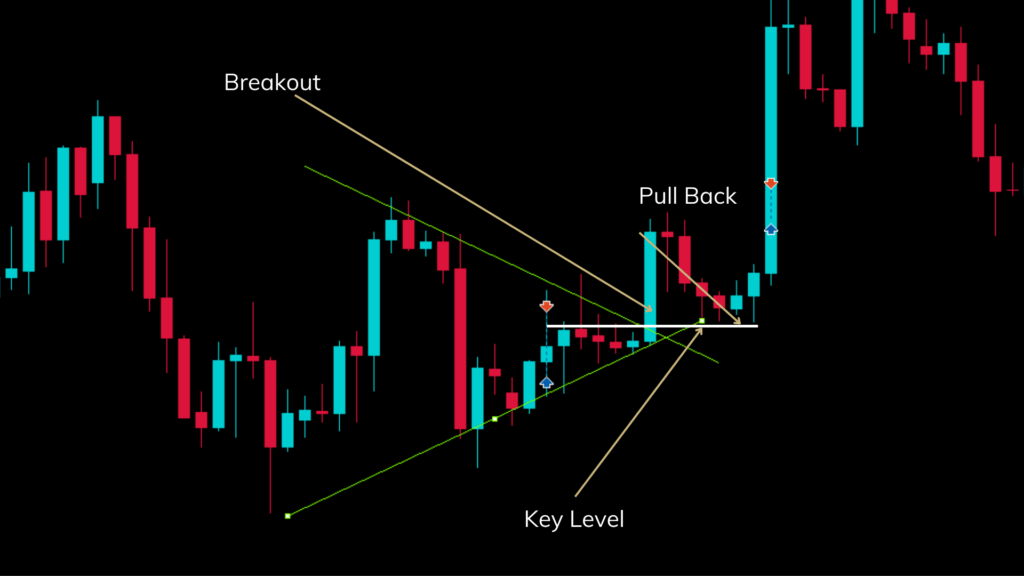
The breakout strategy is one of our favorite trading strategies. Let’s take the symmetrical triangle example below.
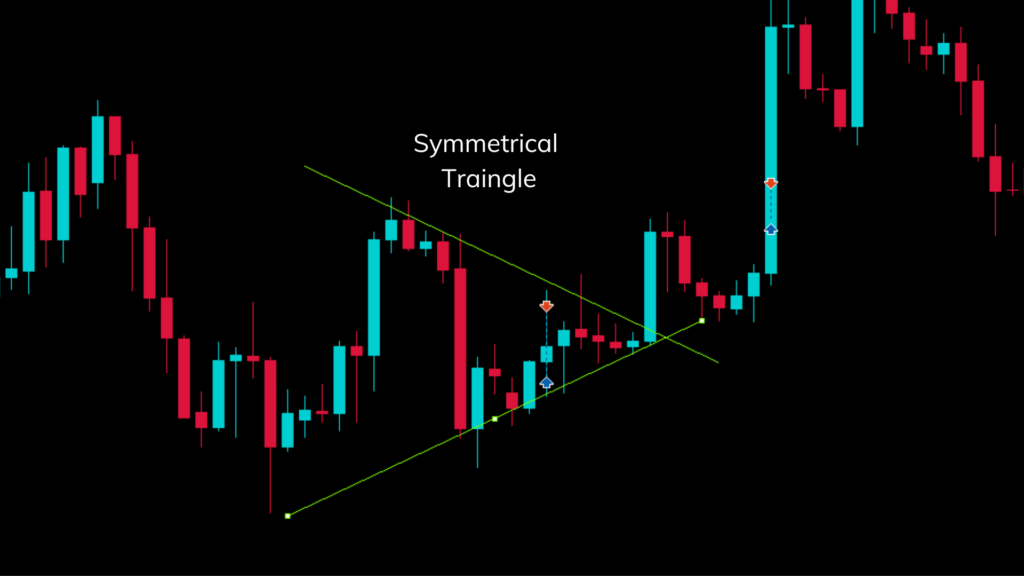
As you can see the markets breakouts out at the end of the symmetrical triangle. For the best chance of making profits with the breakout, it is good to wait for a pullback to the start of the breakout and then enter a trade.
You can enter the trade as shown in the following chart. You can place the stop loss and take the profit as shown in the chart.
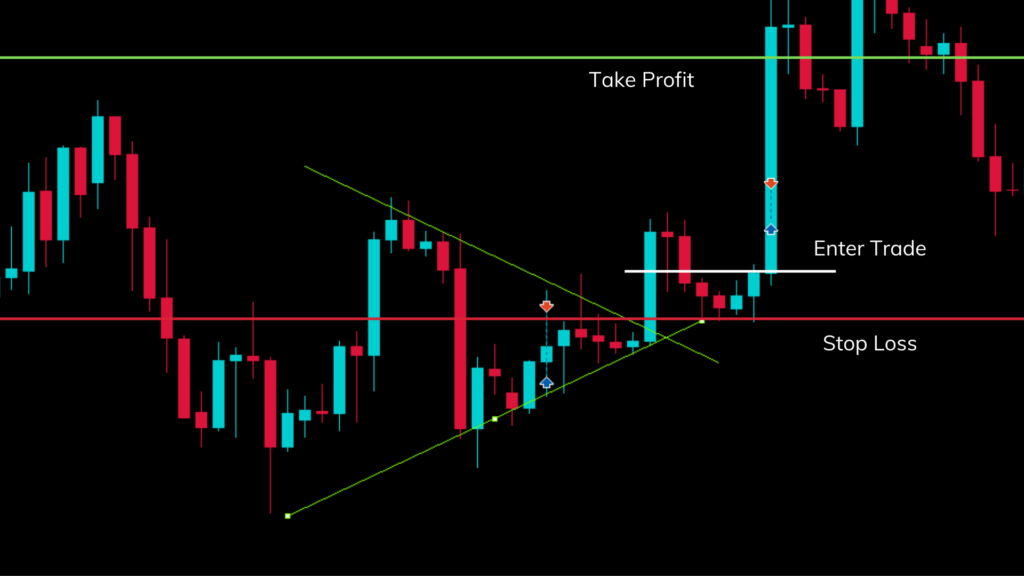
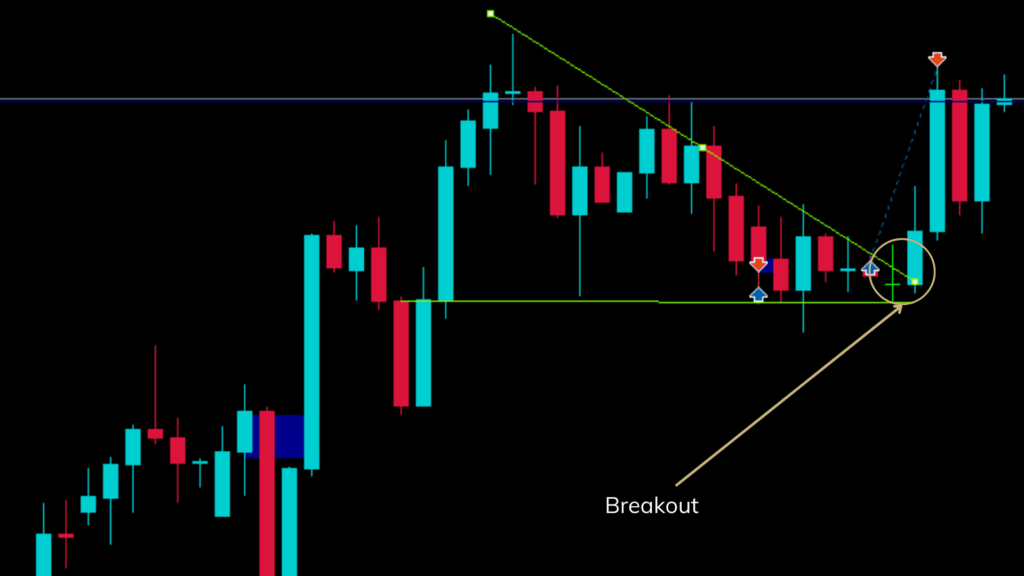
As you can see trading the breakouts is a nice and effective way to trade. It is important to identify breakouts properly and avoid fakeouts. The following chart shows another example of a breakout.
Supply and demand Trading Strategy
The final strategy we are going to discuss is the supply and demand strategy. For this strategy, we need to find the supply or demand zones. Supply zones are where aggressive selling starts to happen. Demand zones are where aggressive buying starts to happen. The following chart shows a demand zone.
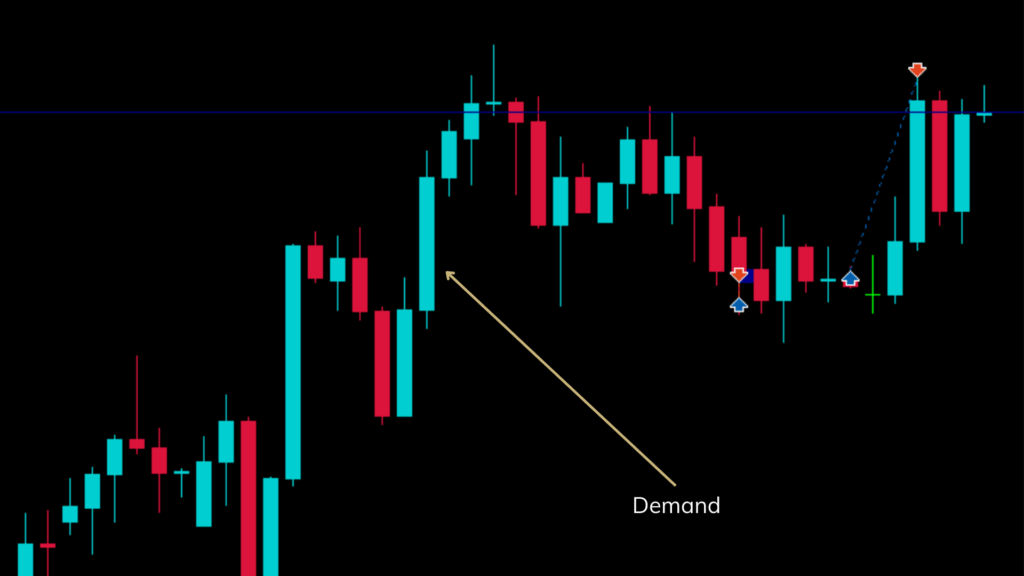
Now we need to mark the demand zone. To mark the demand zone we have to look to the left of the zone to find any consolidations. This is shown in the following chart.
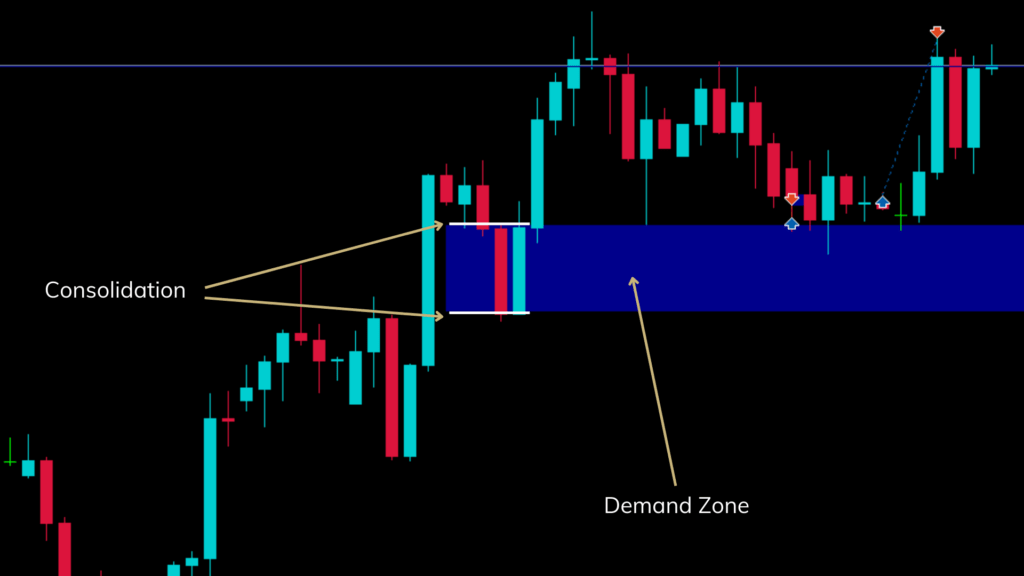
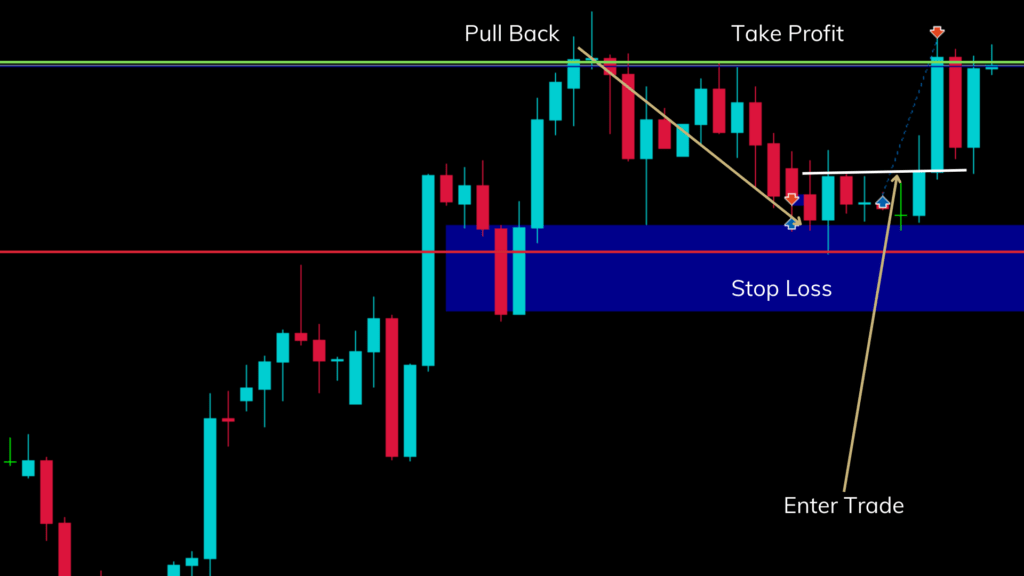
After you find the demand zone, you wait for the market to pull back to the demand zone and form a bullish candle. This is a good point to enter a trade for the supply and demand trading strategy.
Conclusion
There are great forex trading strategies that you can trade, without using any technical indicator. As we discussed in this article, this type of trading is called price action trading. If you like trading without indicators we recommend you learn these strategies and practice these strategies in the real markets.
If you want to learn more about forex trading, you should check out our complete guide to learning how to trade forex.

