In this article, we will be focusing on technical analysis with detailed explanations of some of the important indicators that are used by successful traders. If you learn to use these indicators properly they can give you strong signals on when to buy or sell a certain currency pair.
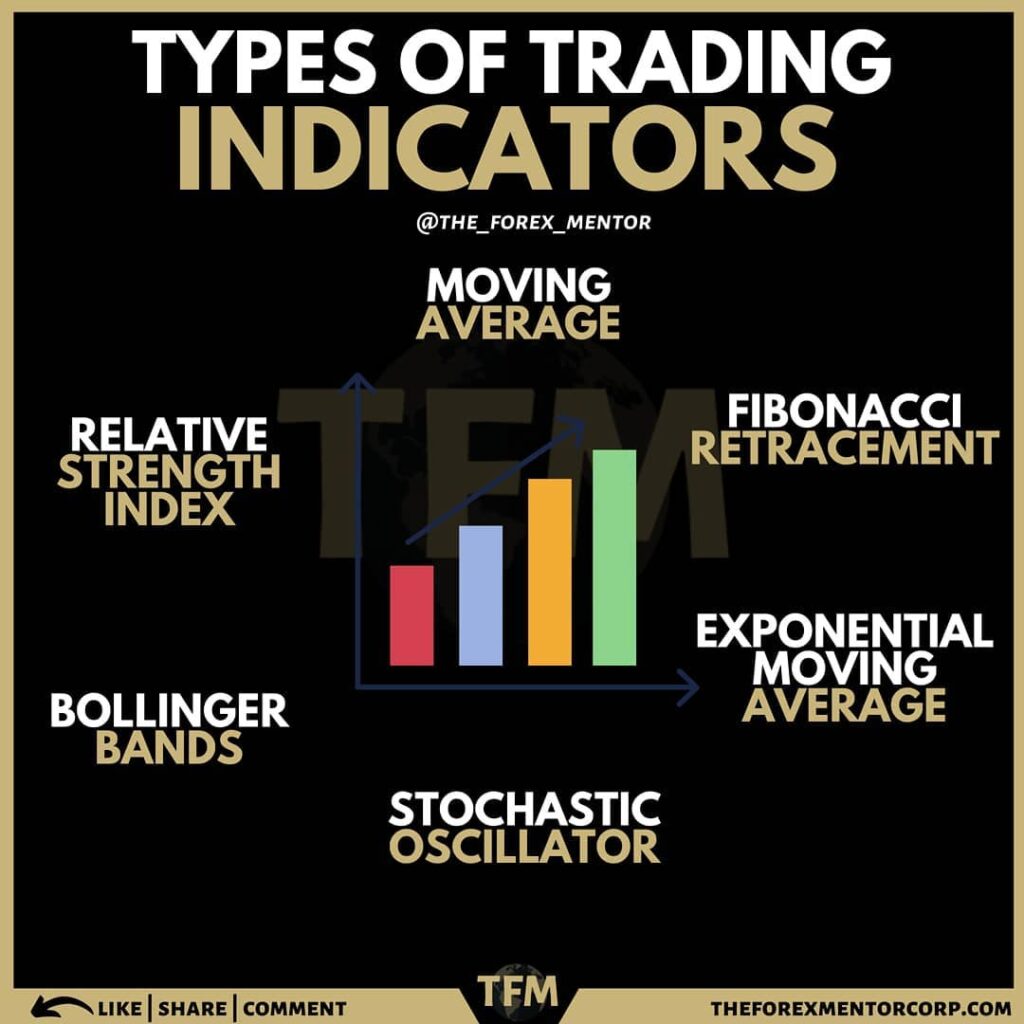
It is a known fact that all successful traders use technical analysis but not all technical analysis traders are successful, although technical analysis is the most precise and the best way of trading the Forex market.
It’s also useful to note that fundamental analysis plays a part in indicating whether a price will move up or down. It gives you the edge over other traders. But in this article, we will not discuss fundamental analysis.
Technical Analysis is so powerful because of a few reasons which are listed below:
- It represents numbers. All information and its impact on the market and trades are represented in a currency’s price.
- It helps to predict trends and the foreign exchange market is very ‘trendy’.
- Certain chart patterns are consistent, reliable, and repeat themselves. Technical analysis helps us to see these patterns.
Here’s one way of putting technical analysis into perspective. We all know that prices move in trends. Research has shown that those who trade ‘with the trend’ greatly improve their chances of making a profitable trade.
Trends help you become aware of the overall market direction and often rescue us from less-than-profitable entry points.
So, learning the ‘tools of the trade’ the technical analysis indicators and their applications will help you to diagnose what the market is doing but even then you need to expect ups and down and trade with emotional control. Also, technical Analysis can help you take your emotions out of the equation.
Always remember to stay with the trend and follow the price. Find the price of the currency pair. If EUR/USD is 1.4224 and moves to 1.4180 then 1.4090 then the market is in a downtrend. Concern yourself only with what the market Is doing not what it might do. Listen to the markets and the indicators will back up what they are telling you.
1. Moving Averages
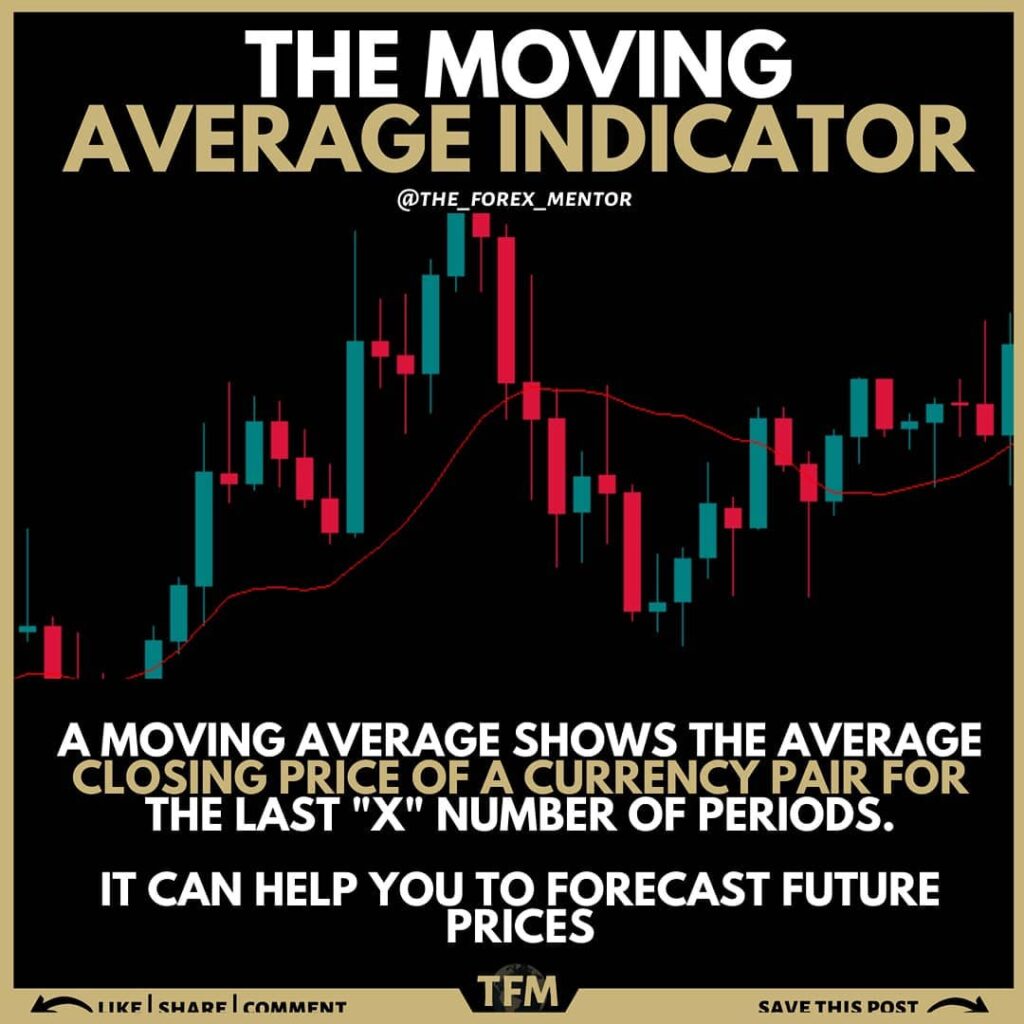
Moving Averages tells you the price at a given point of time over a defined period of intervals. They are called moving because they give you the latest price while calculating the average based on the selected time measure.
They lag the market so to give you an indication of a change in trend, use a shorter average such as a 5 or 10-day moving average. By combining a shorter-term and longer-term moving average, you can detect a buy signal when the shorter term crosses the longer-term moving average in the upward direction. Or a sell signal if it crosses in a downward direction.
For example, you could use a 5-day versus a 20-day moving average or a 40-day versus a 200-day moving average.
There are simple moving averages, linearly weighted which give more importance to the recent prices or exponentially weighted. The latter is a favorite among elite traders because it considers all prices in a time period but emphasizes the importance of the most recent price changes.
MACD
Based on moving averages, a MACD plots the difference between a 26 exponential moving average and a 12-day exponential moving average, with a 9-day used as a trigger line. If a MACD turns positive when the market is still plummeting it could be a strong buy signal. The converse also works.
2. Bollinger Bands (Sounds like An Elastic Band)
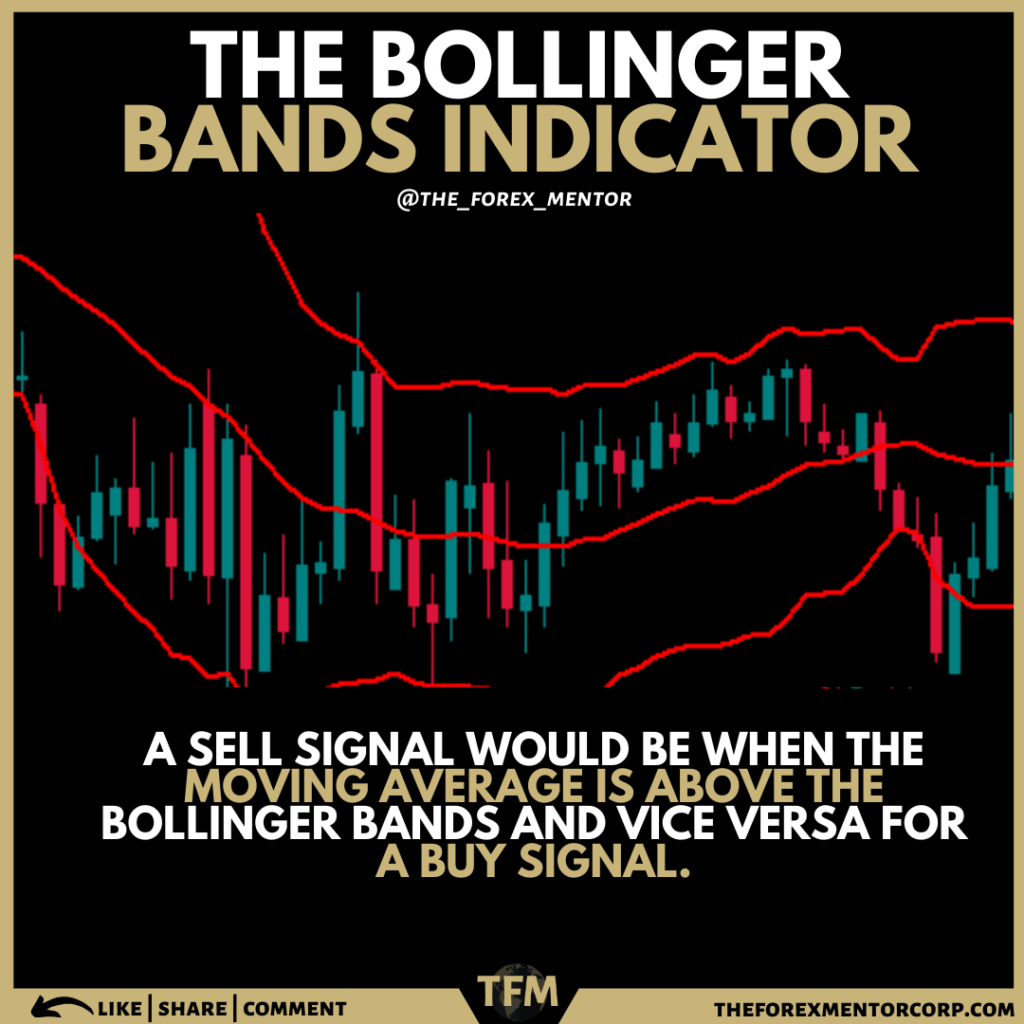
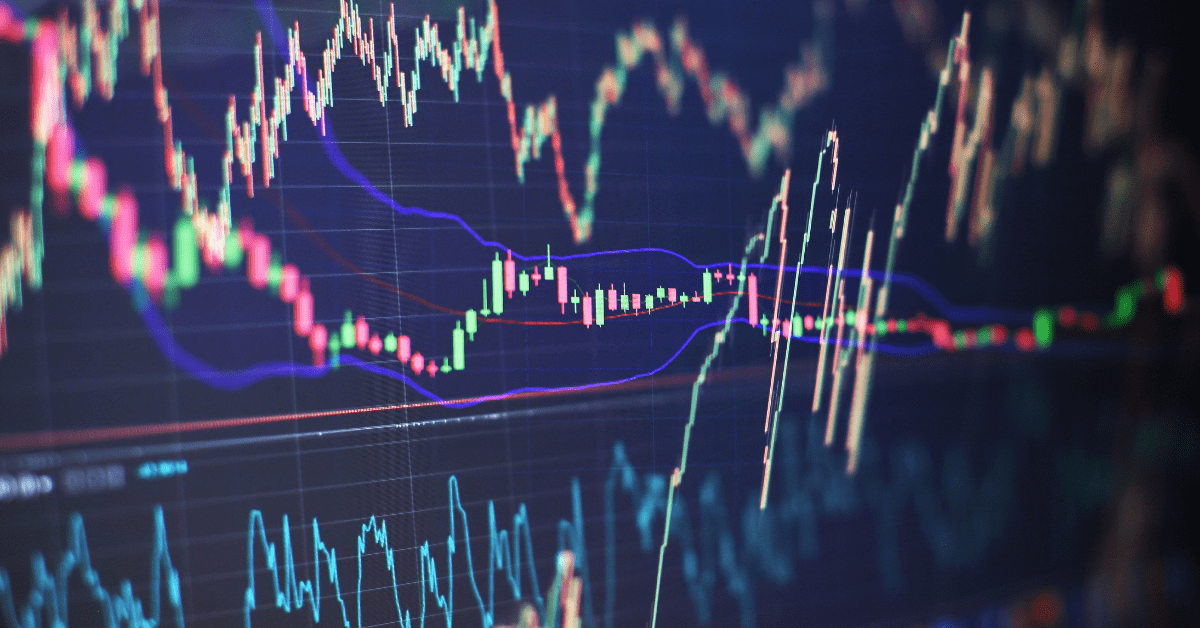
Bollinger bands use a statistical measurement known as the standard deviation. It uses it to establish where the band of support and resistance might be.
In a Bollinger band, shown to the left, the prices tend to stay between the upper and lower bands. They widen and become more narrow depending on the volatility of the market at the time. A sell signal would be when the moving average is above the Bollinger bands and vice versa for a buy signal. Some traders use it in conjunction with RSI, MACD, CCI, and Rate of Change.
There are really good trading strategies based on Bollinger bands which will be discussed in other articles.
3. Fibonacci Retracement
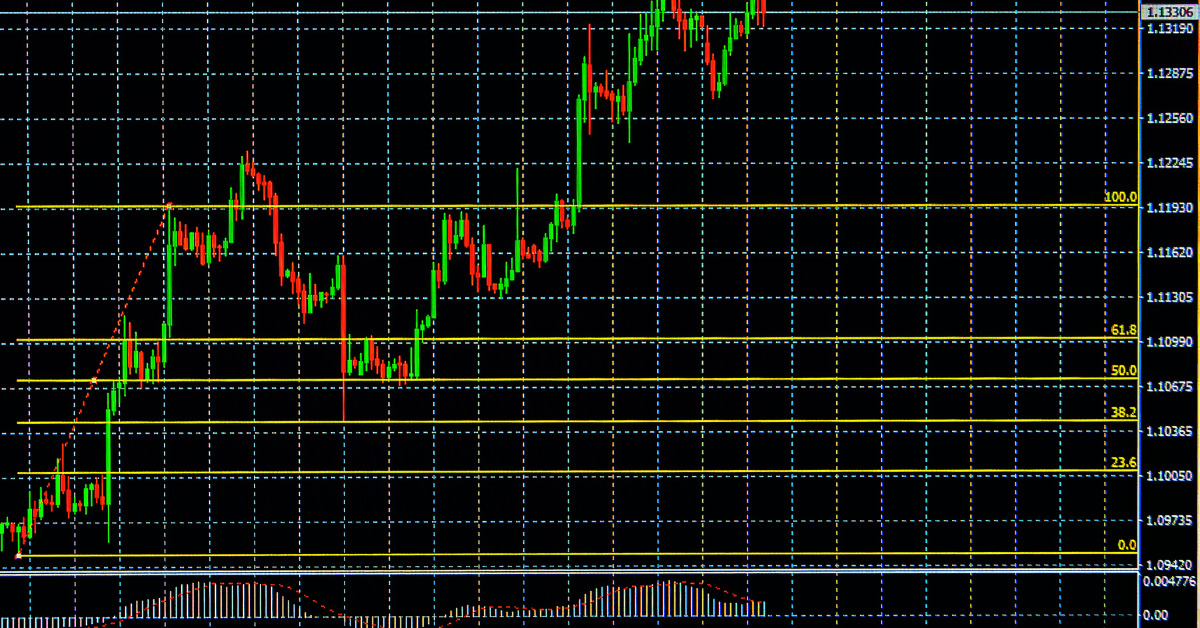
The Support and resistance levels often occur near the Fibonacci Retracement levels. The support and resistance levels are indicated by horizontal lines.
It can be very useful when applied to technical analysis, it can find shifts in market trends. After a climb prices often retrace a large portion, sometimes all the original moves.
The Fibonacci Retracements levels are drawn between the recent Swing high and the Swing low.
4. Relative Strength Index
The relative Strength Index measures the market activity to see whether it’s overbought or oversold. This is a leading indicator, so helps to indicate what the market is going to do (awesome!). A higher RSI number indicates overbought (so expect a bearish shift) and a lower number indicates oversold.
5. Stochastic Oscillator
A stochastic oscillator can help traders to find when a trend might be ending. Also, it tells when the market is overbought or oversold. If the stochastic lines are above 80 then the market is overbought. If the lines are below 20 then the markets are oversold. In each scenario, a trader can expect the market to reverse.
Final Thoughts
Usually, successful traders will generally use 3 or 4 signals to provide a more conclusive signal before entering a trade or exiting a trade.
Always remember, “If in doubt, stay out!”. Technical analysis doesn’t factor in political news, a country’s economic profile, or fundamental supply and demand.
Technical Analysis helps us figure out how much money to risk on a trade. How and when to enter the market and how to exit the trade for profit or to minimise loss. Also, it is important to note that when trading does not completely ignore the other types of analysis, fundamentals, and sentiment.
If you are interested in learning how to trade forex, make sure to check out our completely free guide here.


