Lesson 1: The Mindset of a Master Forex Trader – How Do you Develop A Trader’s Mindset?
In this guide, we will talk about how to develop a trader’s mindset. Before we get into learning about forex trading, you need to understand the psychology that goes into becoming a profitable trader. Trading is not easy, as with everything that is worthwhile.
Be Emotionally Disciplined and Have A Plan
For a trader, emotional discipline and consistency are key. Depending on your trading style, you have to be consistent. The following are a few tips to be consistent with trading.
Have a Set time Every day that you Trade
If you have a full-time job, you can trade before your work or after you finish work. Remember to keep it consistent, if you choose to trade before your work, stick to that routine. Another tip for traders who have full-time jobs is to do swing trading.
Swing trading is a trading style where you hold a trade for days or weeks. This way you don’t necessarily have to trade every single day, but you will need to check up on your trades every day. With this trading style, you will only have to take 1–3 trades a week, and you only need 30 minutes per day.
Have a Trading Plan & Goals

Another important thing is to have a trading plan. Always stick to your trading plan no matter what. Yes, you can improve your trading plan but do it one step at a time. Don’t try to change too many things at once. It’s all about executing this plan day in and day out and being patient with it.
Before getting started, you need to have a goal. Make sure that you have a clear goal and then you can break it down. Let’s say you want to grow your trading account to $12,000 by the end of the year. That means you need to grow your account by $1000 per month and $250 per week.
It is important to focus on growing the money in your account and don’t take any money out of your account. This way you will be re-investing your profits which will make your account balance larger. If you have a bigger account balance, with each profitable trade you make, you will make a larger profit.
Keep a Trading Journal
Always keep a journal. Having a trading journal helps you to track your trades. This way, you will be able to reflect on your trades and make proper trading decisions. In your trading journal, make sure to put comments on why you entered the trade and why you decided to exit the trade.
If you are interested in getting a trading journal, make sure to check out our trading journal. It is completely free to use (It is on Google sheets)
How to Actually be Profitable in Trading
It is important to note that every trade will not be profitable. There are two main ways to be profitable with trading. One is to have a high win rate, and the other is to make your winning trades larger than your losing trades.
With the first method, you need to have a good winning rate, which is harder to do than with the second method. But the benefit of the first method is that you can have a risk-to-reward ratio of 1:1. But this is not the recommended way to make profits in the forex market.
With the second method, your win rate doesn’t matter as long as you keep your winning trades large. For this method, you need at least a 1:2 risk-to-reward ratio. We recommend you have at least a 1:3 risk-to-reward ratio.
Jack of All Trades vs Master of One
If you want major success in forex trading, you have to be a master of one. First, you need to master 1 strategy or a maximum of 2 strategies that complement each other. Also, focus on trading forex and don’t trade other financial instruments like stocks and options. Make forex your masterpiece.
Things take time, so be extremely patient and keep improving your trading skills. Over time, you will be able to understand the markets very well, and you will become a very profitable trader.
Also, it is very important that you have your own trading rules. That includes what not to do as well. Make sure to stick to the rules and fine-tune them over time.
How much time do you need to spend on Forex Trading?

When it comes to trading, you do not need to spend a lot of hours every single day. We recommend you commit at least 1 hour per day, 5 days a week, to trading. That’s only 5 hours a week to achieve your financial goals with trading. Now, if you are swing trading, you can actually spend less time every day.
Simply, during the hours you trade, you need to analyze the charts of currency pairs that you want to trade and look for trade entry points and exit points. Also, we recommend you time block a couple of hours per week to backtest your strategy, which we will discuss in a later section.
Make Trading a Habit
When something becomes a habit, you don’t have to have the motivation to do it. So, set a time every day for forex trading. We recommend you set at least 1 hour for trading. Minimum of 30 minutes to check the markets and 30 minutes for backtesting.
Be consistent with it and you will become a successful trader. And if you continue this for at least 90 days, you will be a more proficient trader.
Lesson 2: Forex Trading Terms and Definitions
Before getting into any forex trading strategies and technical analysis, there are a few basic things that you should know. Below are terms that every trader must know.
Going long – Going long is taking a trade where you buy the currency pair.
Going Short – Going short is taking a trade where you sell the currency pair.
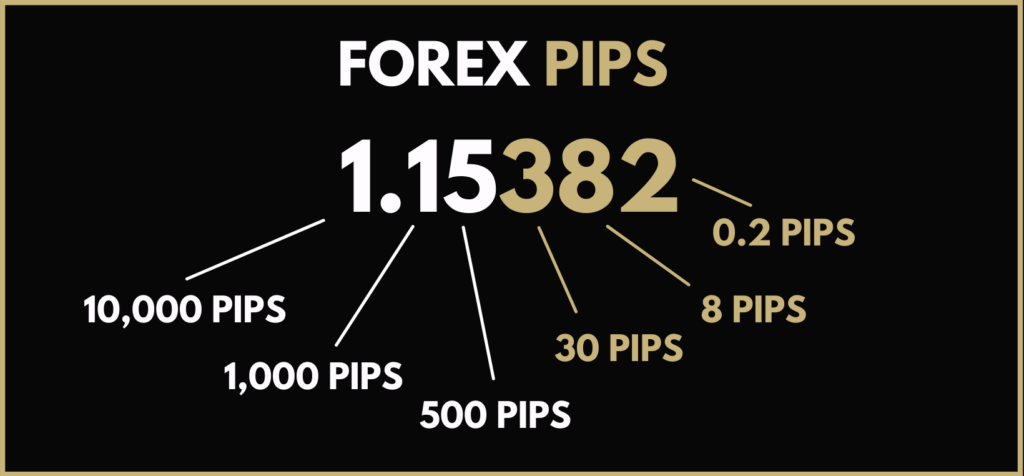
Pips – A pip is the most common standardised unit that is used in forex trading. It is 0.0001 for currency pairs that are related to US dollars and 0.01 for currency pairs that are related to the Japanese Yen.
Pipette – A pipette is 1/10th of a pip. A pipette is not very commonly used among traders. In this guide, we will not be using a pipette.
Quote – a quote is the price of a currency in terms of the other currency in the currency pair.
Ask Price – this price is the price on the right-hand side of a quote. It is the buying price for the currency.
Bid Price – this price is the price on the left-hand side of a quote. It is the selling price for the currency.
Exchange Rate – It is simply the currency of one country against the currency of the other country.
Margin – The amount of money the trader puts in order to maintain the trade.
Spread – The spread is the difference between the ask and the bid price. The asking price is higher than the bid price. Spread is the amount that the broker makes when you execute a particular trade.
Lot – It is the standard unit of measurement. For example, if you buy 1 lot (standard lot) that means that you buy 100,000 units of the currency. There is also a mini lot (10,000 units) and a micro lot (1,000 units).
Leverage – Basically, leverage is the number of funds that the broker loans you. Some brokers provide you with up to 1000 times of leverage. We do not recommend you trade with too much leverage. Higher leverage means higher risk. We will talk more about how much leverage to use later.
Calculating Pips
Let us calculate the number of pips that you gain or lose when you make a trade. For example, let us use EUR/USD = 1.22972. Since it is a USD pair, 1 pip is equal to 0.0001. Let us say that you buy the currency at 1.22972 and the price moved by 2 pips. That means the price increased by 0.0002, so the price will be 1.22992. But how do we know how much in dollars we made? Well, it depends on the lot’s value.
Let us say that you traded using a standard lot using leverage. That means the value of the currency pair will be 1.22972 *100,000 EUR = 122,972 USD. Then, after the movement of 2 pips the profit you have made will be, 122,992 USD – 122,972 USD = 20 USD
Lesson 3: What Currency Pairs To Trade in Forex
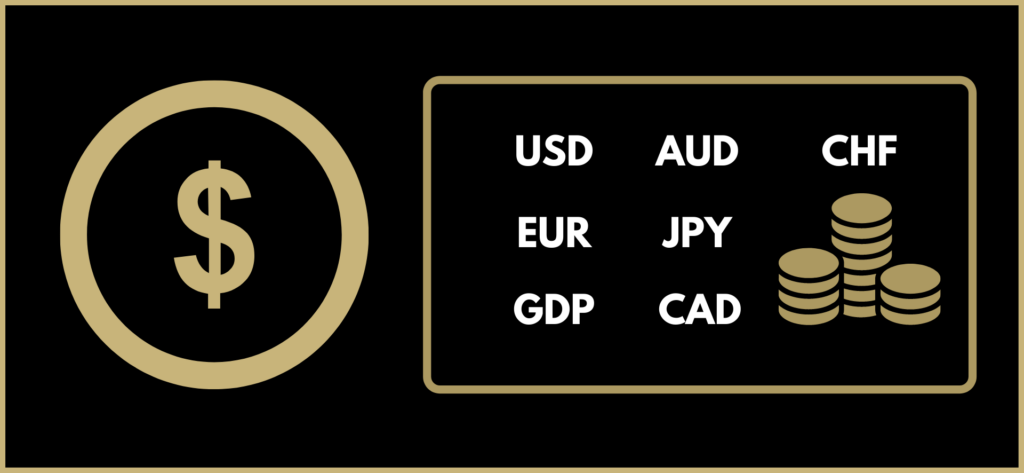
There are only a few currency pairs that are traded heavily, they are.
- USD (US Dollar)
- EUR (Euro)
- GBP (British Pound)
- AUD (Australian Dollar)
- JPY (Japanese Yen)
- CAD (Canadian Dollar)
- CHF (Swiss Franc)
USD is the most traded currency in the Forex Market. Now, there are currency pairs called majors and crosses. Major currency pairs are the currency pairs that we recommend you trade. Below shows a table of majors and crosses.
Majors
- EURUSD
- USDJPY
- GBPUSD
- AUDUSD
- USDCHF
- USDCAD
Crosses
- EURGBP
- GBPJPY
- AUDCAD
- etc
How many currency pairs do you need to trade to make a living
Depends on your trading style. We personally recommend you Day trade or Swing trade. With Swing trading, you will hold the trade between 2 days to a week. So, it is a good idea to analyze all the major currency pairs every day and look for trade entry points.
You will not always have good trade entry points for certain currency pairs, that’s why we recommend you check all the majors. If you are a beginner or even an experienced trader, trading multiple currency pairs is the way to go.
Lesson 4: Fundamental Analysis

Fundamental analysis is analysing the forex market by looking into the social, economic, and political factors that affect the currency pair. The best way to do a fundamental analysis is to look at the economic calendar.
We personally do not recommend trading using fundamental analysis alone. But it is wise to look at the forex economic calendar to see if there is major news that will affect the price of the currency pair.
You can find many sites that provide a forex economic calendar. Below is a picture of an economic calendar by the forex factory.

For example, on Tuesday, December 29 at 9.00 am there was a news release for the USD. This news affected the price of the USD.
Our recommendation is to check the news whenever you are about to enter a trade after doing a thorough technical analysis. If the news release negatively affects the currency, avoid entering the trade.
Now that we have talked about fundamental analysis, let us jump into the stuff that is going to make you serious money, technical analysis.
Lesson 5: Forex Trading Technical Analysis
Types of Charts
There are 3 main types of charts in forex trading. They are:
- Line Chart
- Bar Chart
- Candlestick Chart
In this guide, we will not be focusing on the line chart and the bar chart, because they are not used by the majority of the traders. The only chart type we will be using is the candlestick chart. Below is an image of the Candlestick chart in MetaTrader 4.
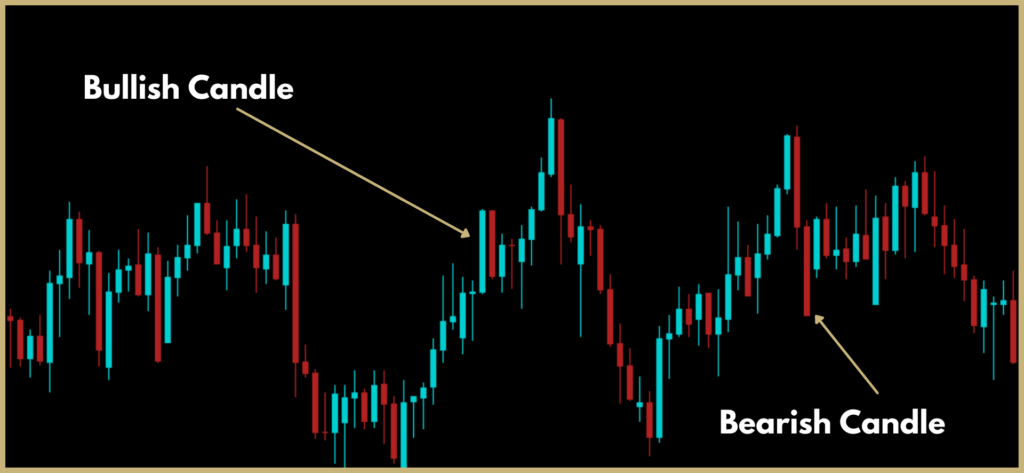
The chart above shows candlesticks with 2 different colors these are the bullish candle and the bearish candle. The green candle is the bullish candle where the opening price is at the bottom and the closing price is at the top.
The red candle is the bearish candle where the closing price is at the bottom and the opening price is at the top.
Technical Analysis
When it comes to technical analysis there are several methods to analyze the market. These can be mainly through technical indicators or price action methods. We first go through basic technical analysis methods that you can start utilizing today. In the advanced section, we will go through all the technical analysis methods that will help you take your trading to the next level.
Support and Resistance
Understanding support and resistance is very important. It is crucial to learn how to find support and resistance zones properly. Below shows a chart with the support and resistance zone drawn.
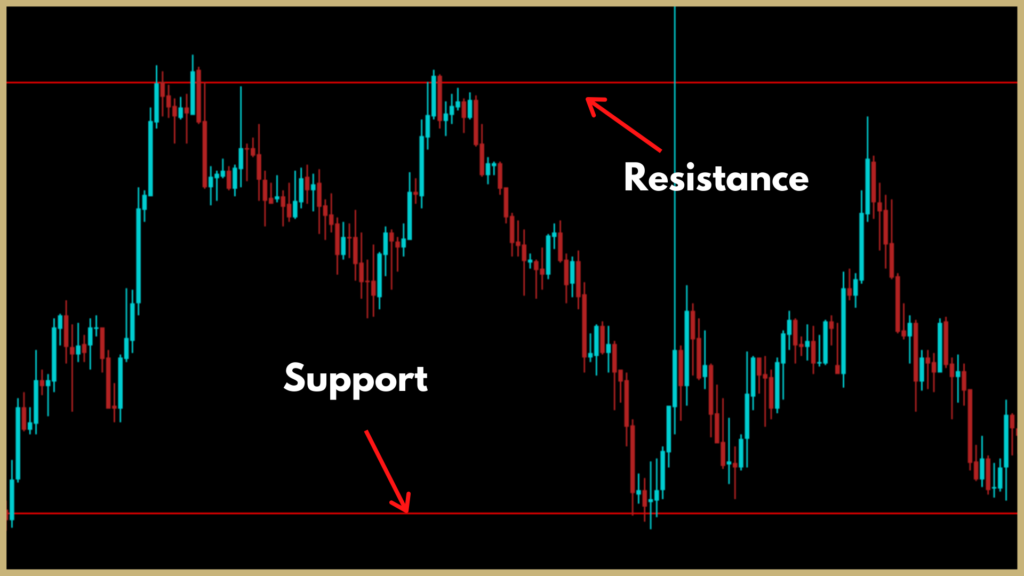
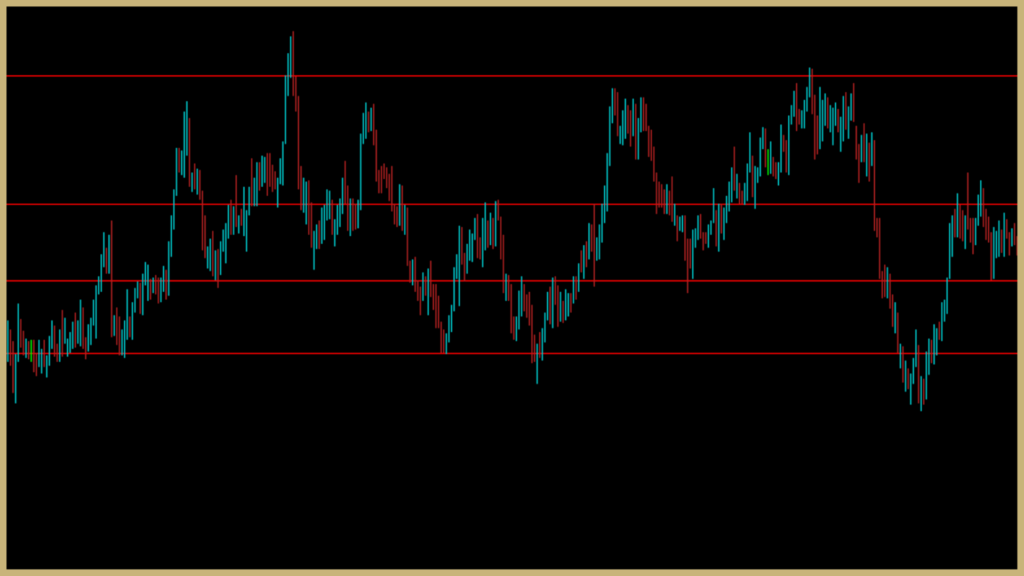
Support & resistance zones are points where the market touches and reverses multiple times. For support and resistance zones to be good the market has to touch them at least 2 times, the more the better of course.
The above pattern is called a horizontal channel. Trading within a channel is a great way to trade reversals. You can enter a trade when the market touches support or resistance. There are a few powerful methods to confirm whether the market will actually reverse or not. This we will discuss in the advanced trading section. But, for now, you need to understand how to find these zones properly.
You can also draw support and resistance in a trending market as well. The pattern below shows a down channel.
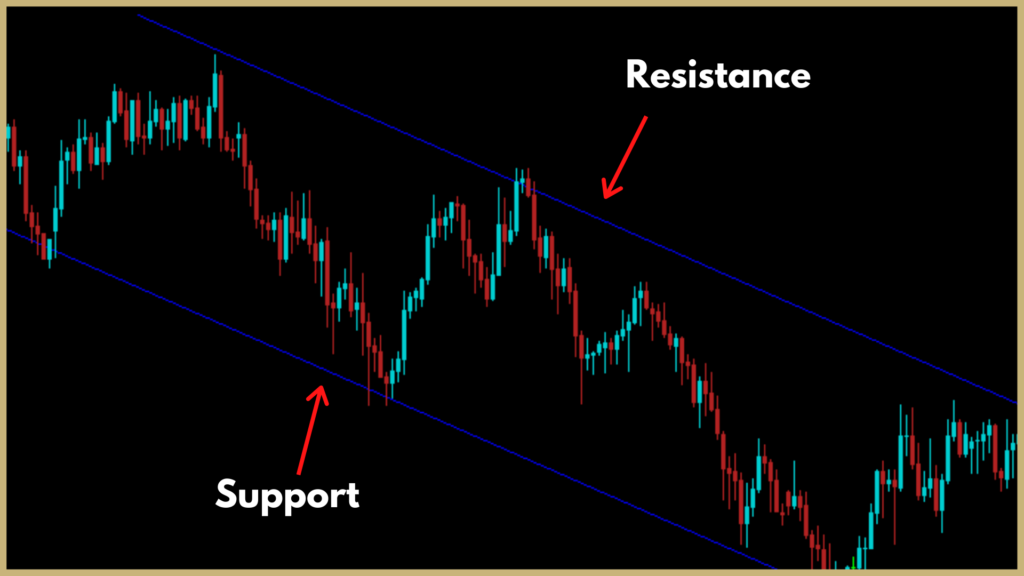
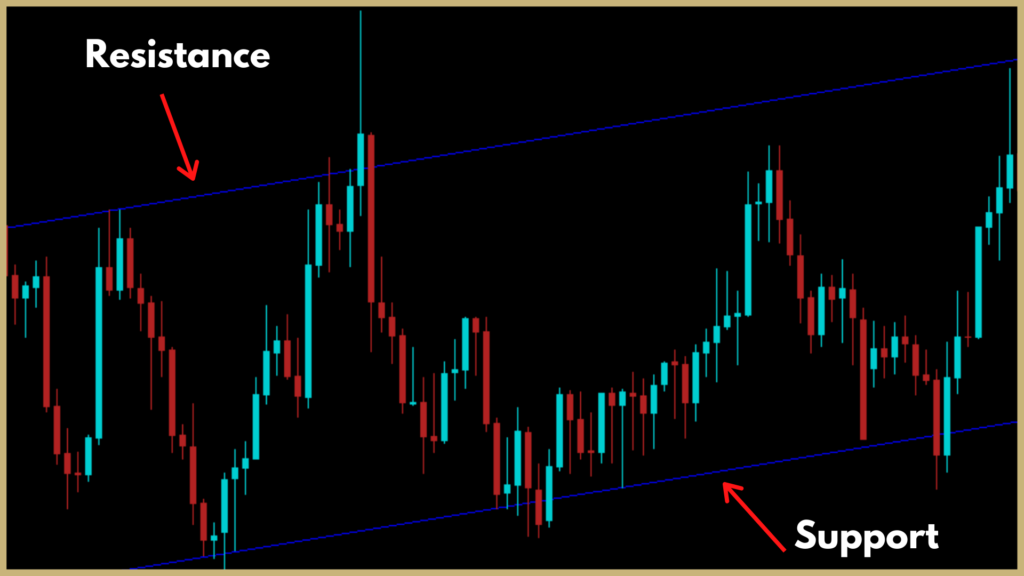
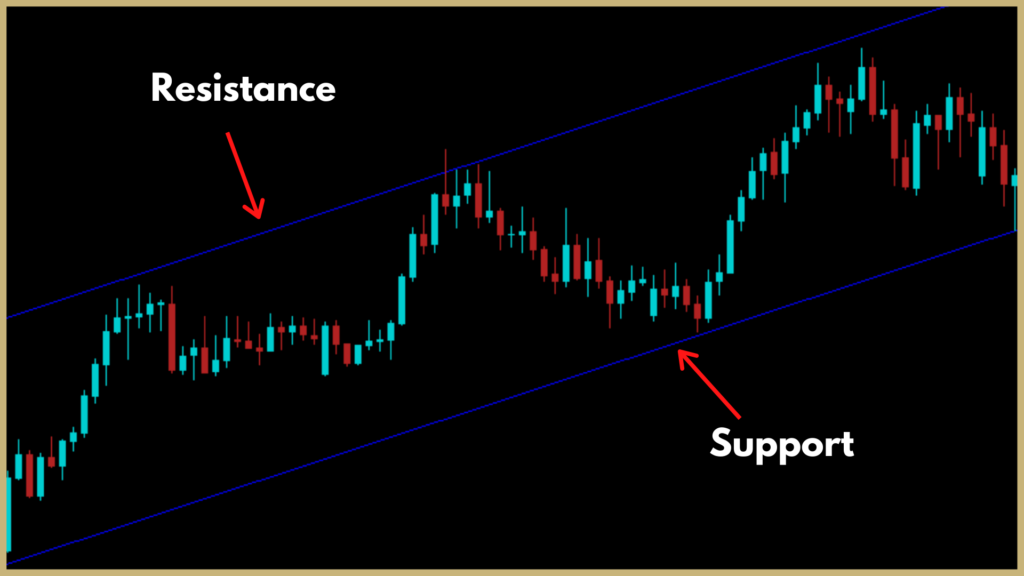
The above chart shows the support and resistance zones drawn on a down channel. You can also have good trades within a down channel or an up channel. The two chart below shows two different up channels.
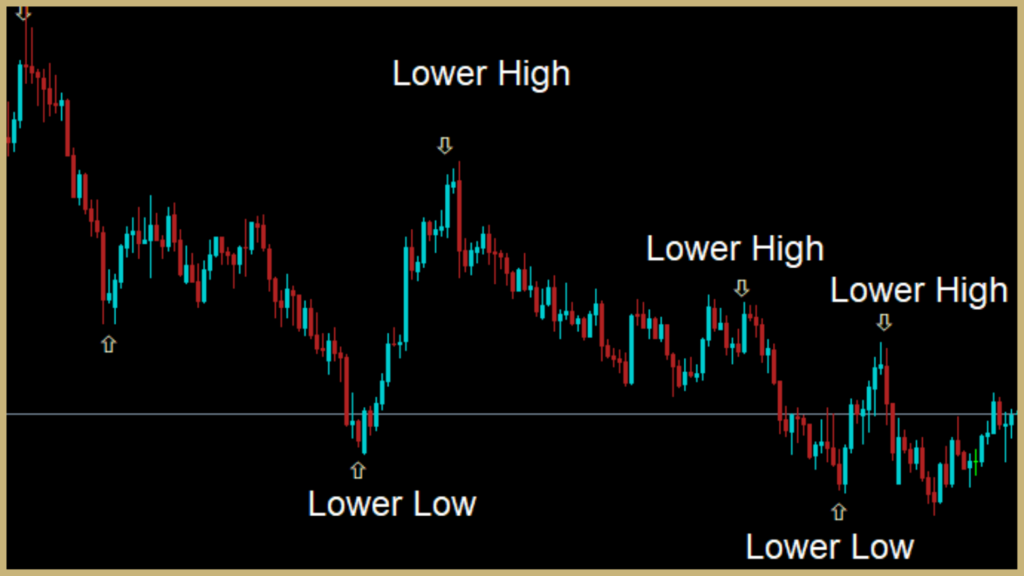
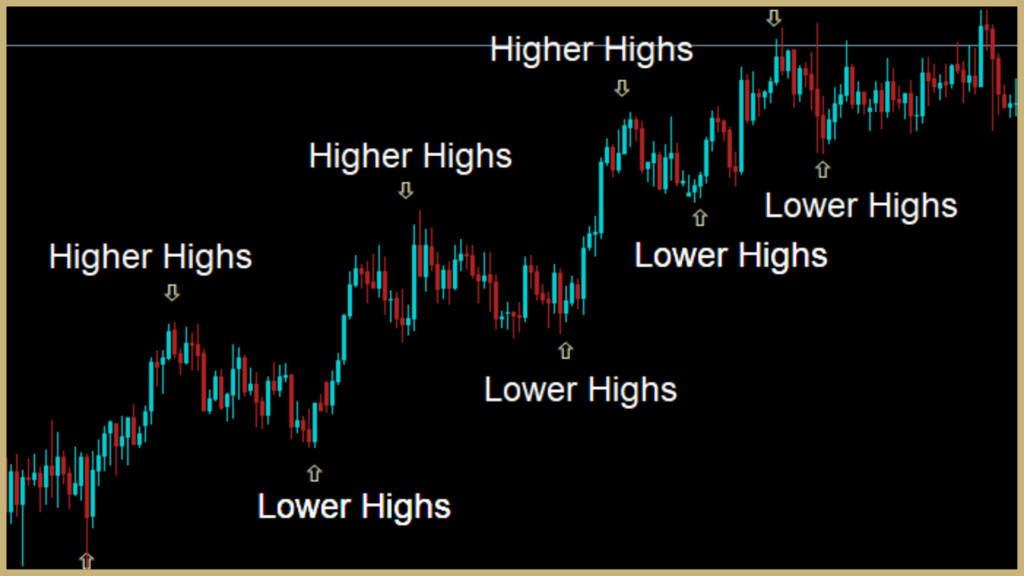
Lower Lows/Lower Highs and Higher Lows/higher highs
It’s important to understand the concept of swing highs and swing lows if you want to find a trend properly. The image below shows lower highs and lower lows being marked using arrows. The image in particular shows a potential downtrend.
The chart below shows an uptrend. You can see the higher highs and higher lows marked on the image.
How to find Major Zones
It is very important to understand how to find major zones in a chart. Take the chart below for example.
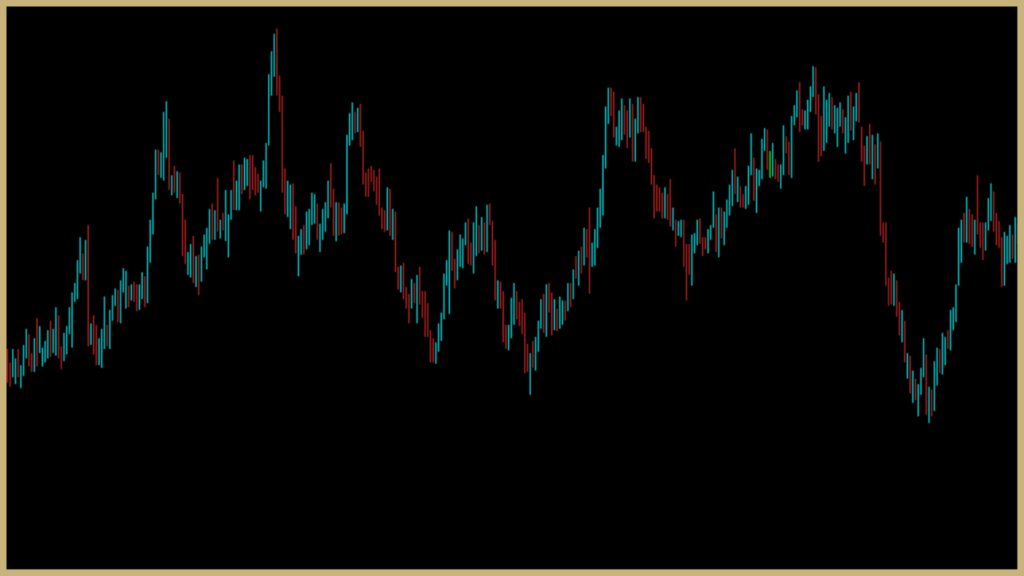
Now take the same chart and draw all the major zones as shown below. As you can see there are multiple support and resistance zones on the chart.
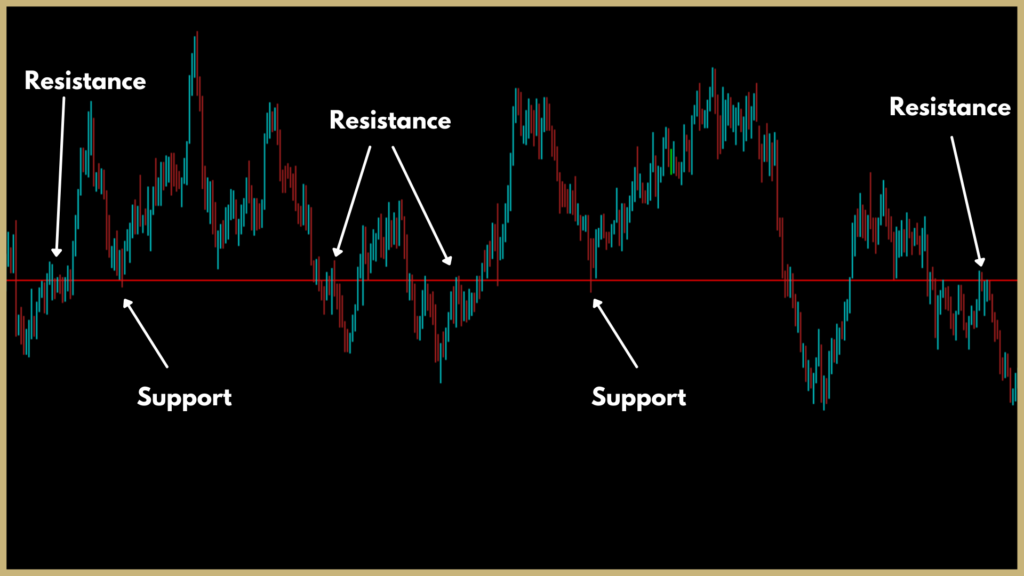
Now let’s analyze one support and resistance line. The chart below shows a support and resistance line marked with an arrow. As you can see the line starts as resistance and then becomes a support and so on. This line is a very important zone and you can expect reversals to happen in this zone further along the chart.
That’s all for the basic technical analysis section. In the advanced section, we will discuss in detail how to confirm reversals and trends. Also, we will discuss advanced profitable trading strategies.
Lesson 6: Risk to Reward Ratio & Position Size
Risk-to-Reward Ratio
Before talking about placing stop losses and taking profit you need to understand position sizing and risk-to-reward ratios.
2:1 Risk/Reward ratio can be that you are risking 20 pips to win 40 pips.
3:1 Risk/Reward ratio can be that you are risking 20 pips to win 60 pips. And so on.
Determining Position Size
Position size is the percentage of the money you are willing to risk per trade. We recommend you risk 1%. That means if your account is a $1000 account you will be risking $10 per trade. Let’s say you do not have $1000. Then you still can start trading with $100. But remember that you cannot make a huge amount immediately starting with only $100. But do not let this discourage you.

Let’s say that you start with $100 and you risk 1%. That is, you risk $1 for every trade you make. Then your goal should be to grow the account. If you stay disciplined and do not take money out of your account just yet you can grow your account to $1000 and then $10,000 and so on.
If you are a beginner then we absolutely recommend you start small. Start with $100 and try to grow it to $200. If you can successfully do that, it means you have a winning strategy. Then you can add more money to your account or just keep growing the money you have in your account.
Now that is out of the way, let us talk about the next important thing. The percentage of winning trades. It is extremely important to know your winning percentage. How to know your winning percentage? That is where having a trading journal is extremely important.
We will talk about having a trading journal in the next section. But let us say for example that your winning percentage is around 70%. That means you lose your trades 30% of the time.
Lesson 7: Guide to MetaTrader 4/5 Platform
In this guide, we will go through the MetaTrader platform. We highly recommend that you sign up with the MetaTrader platform to follow along with this tutorial.
Introduction To Metratrader 5/4
Metatrader 4 is the most used trading software and it is the best out there. You will get a link to download MetaTrader 4 from whichever broker you are trading with. The image below shows the MetaTrader 4 screen.
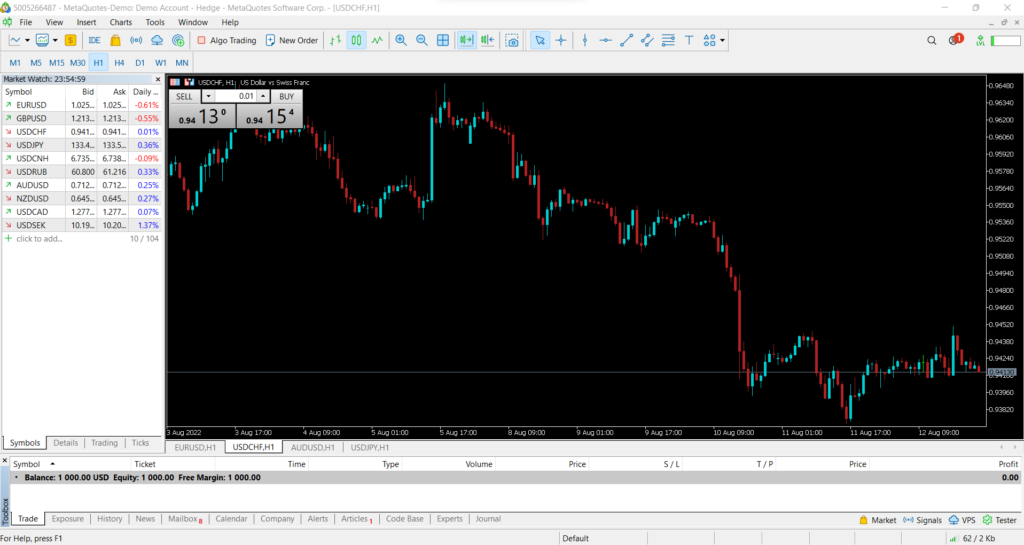
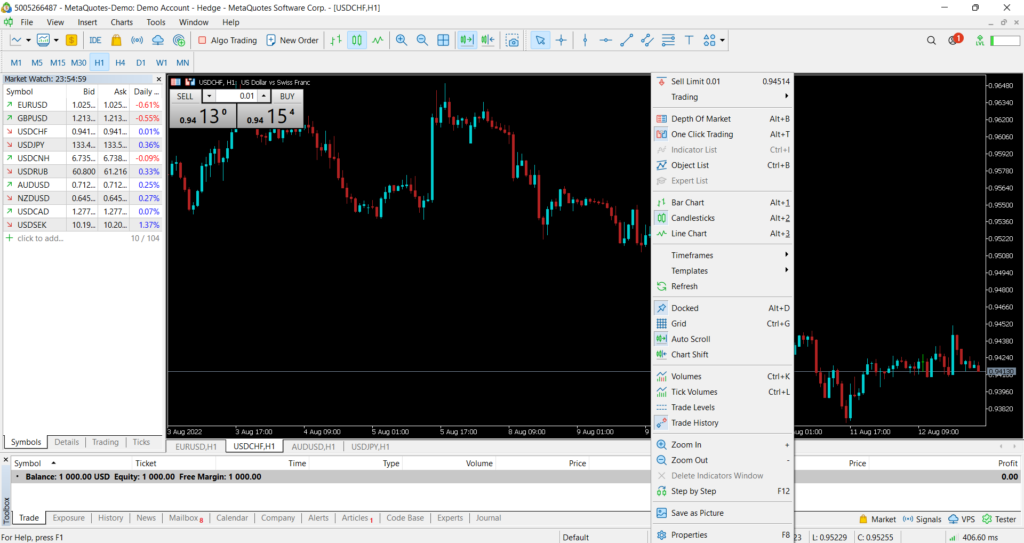
When you load MT4 for the first time you will not see the same colors on the chart as above. But personally, we prefer this color scheme. You can also customize your graph by right-clicking the chart and going to properties as shown in the image below.
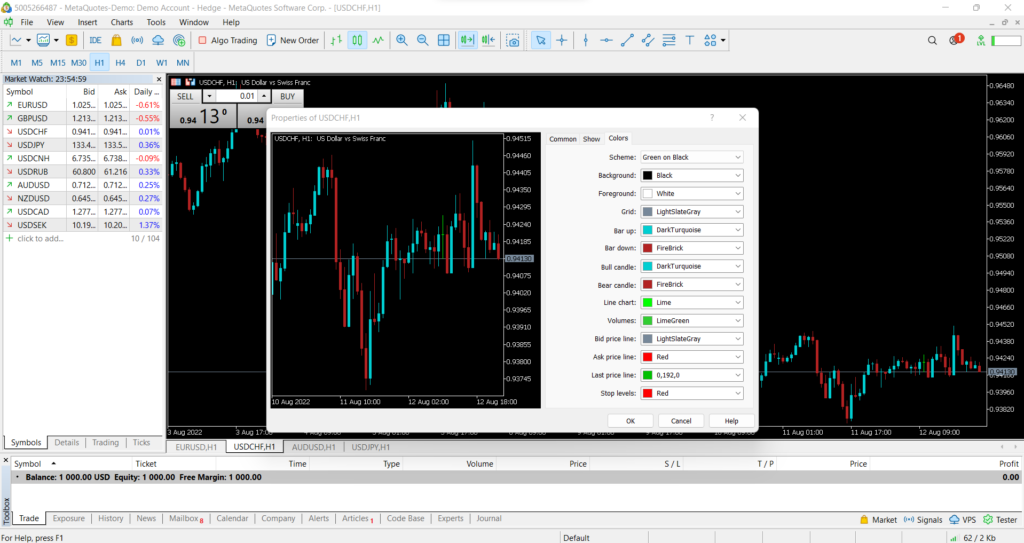
Then, you should get a window like the one shown in the image below. There are different options for you to customize. But we personally recommend you set the color of the bullish candle to green and the bearish candle to red. This will make it much simpler.
The window to the top left shows the currency pairs available. You can drag and drop the currency pair to view it on the chart. If you double-click the currency pair you will get a window where you can place your order. Do not place an order yet, we will talk about that near the end of this chapter.
Above, you can see the navigation panel. Do not worry about it, it will only be useful when using expert advisors (trading robots). In this guide, we will not talk about trading robots and as a beginner, you will not need a trading robot. Later when you become a professional trader then you can use a robot to automate some of your trading decisions.
Placing Indicators in Metatrader 5/4
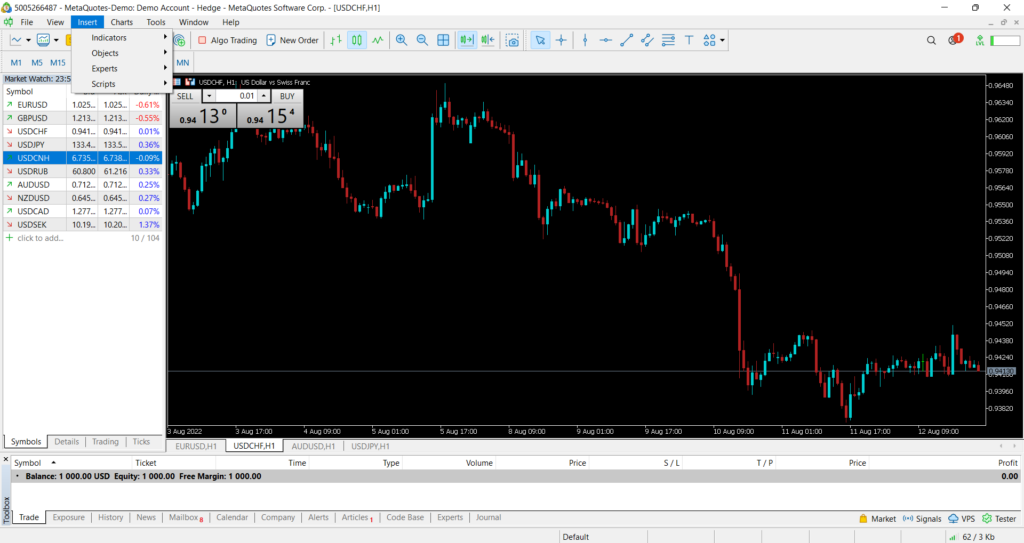
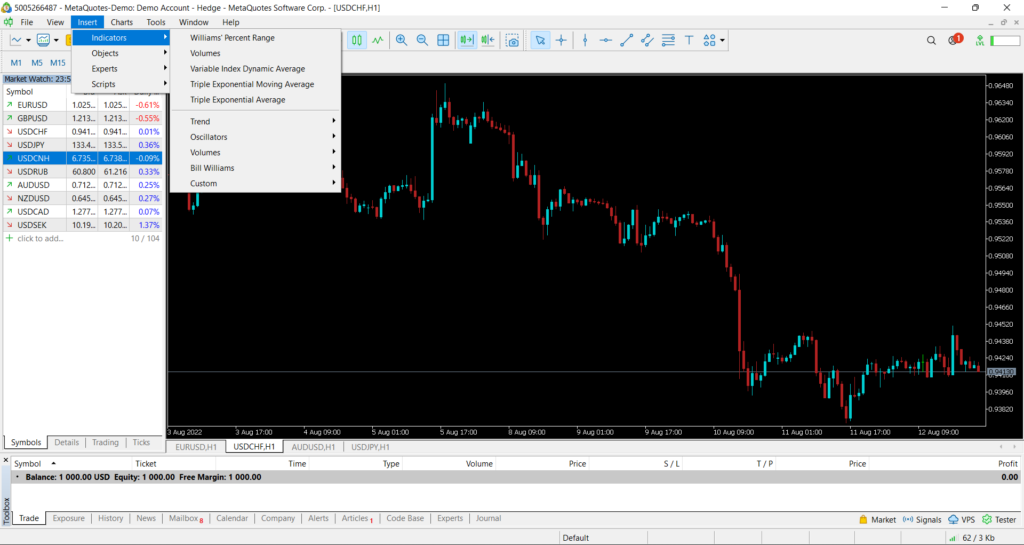
To add technical indicators and other stuff like text or shapes click the insert menu on the top. Your mt4 platform should have all the indicators necessary for you to be a successful trader if you prefer trading with indicators.
Placing your order in MT4/5
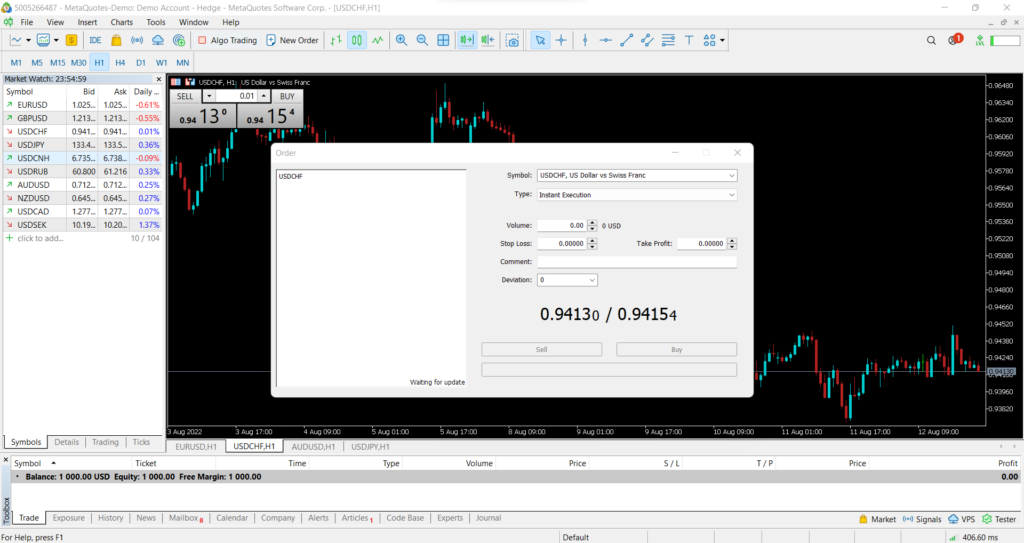
Placing an order using mt4 is simple. To place an order, click the new order button on your mt4 platform.
When placing a trade, first you need to determine whether you are going to place a sell order or a buy order. Then you need to set the stop loss and take profit depending on your risk-to-reward ratio. The volume is the amount of money you are willing to risk. As discussed in the previous sections you should risk 1-2% per trade.
Lesson 8: Guide to Forex Dojis
Dragonfly Doji
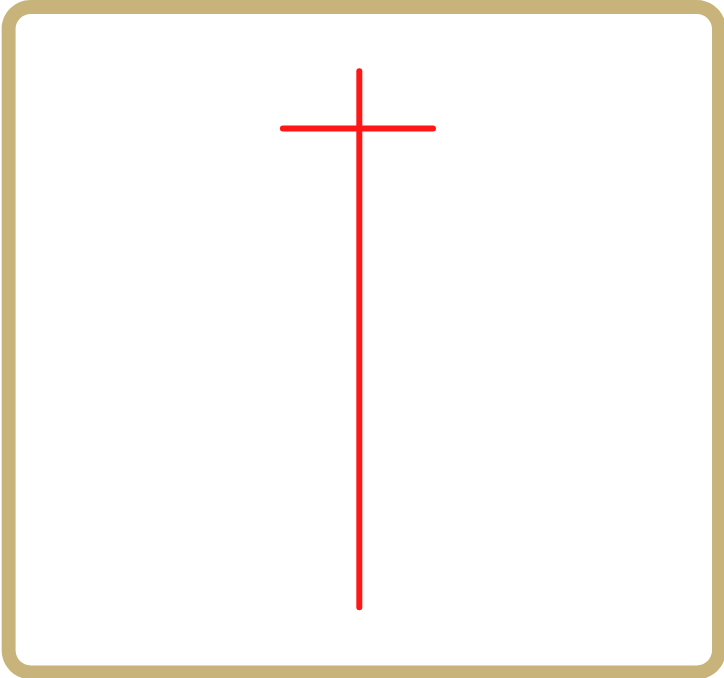
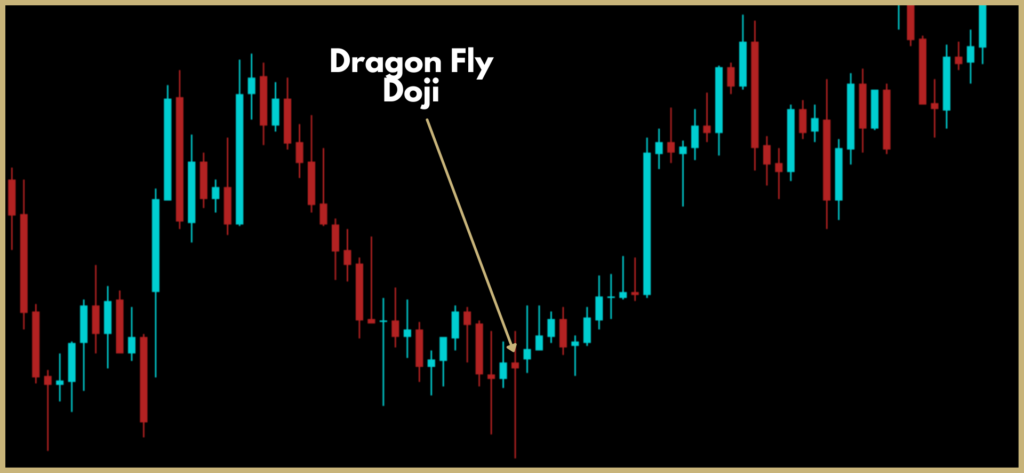
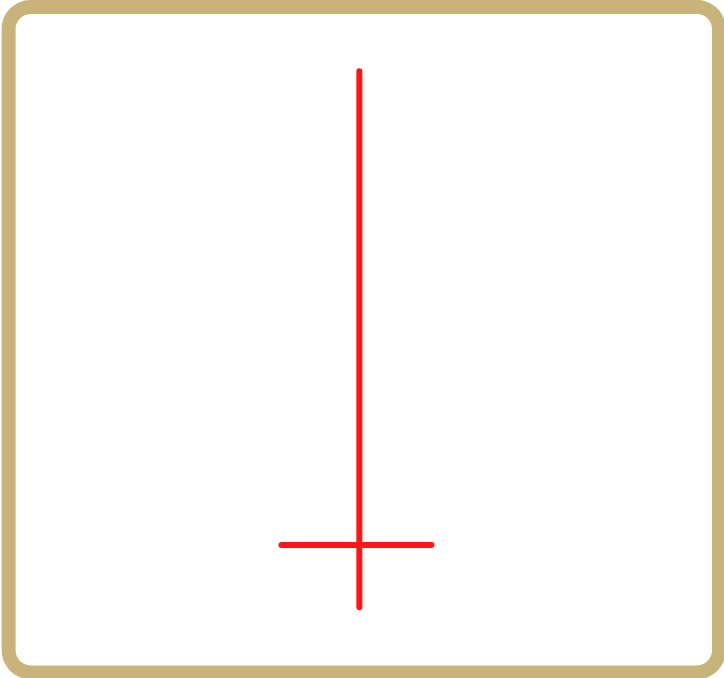
Dragonfly Doji is a bullish reversal pattern. It has a very small real body. It has a very long lower shadow and a very short upper shadow.
For the Dragonfly Doji to be applicable the market must be in a downtrend. Below is an example of a Dragonfly Doji spotted on a daily chart. The market was in a clear downtrend before the pattern appeared. After the pattern, the market reversed its direction.
Gravestone Doji
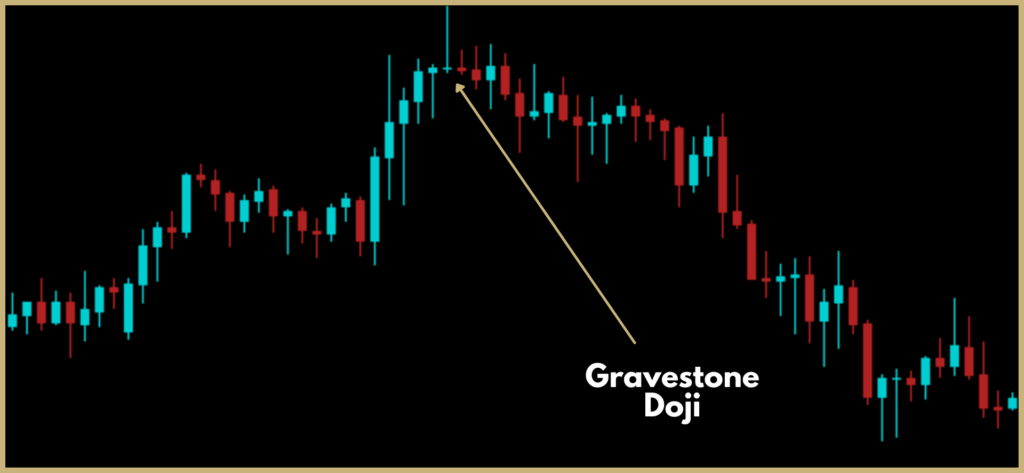
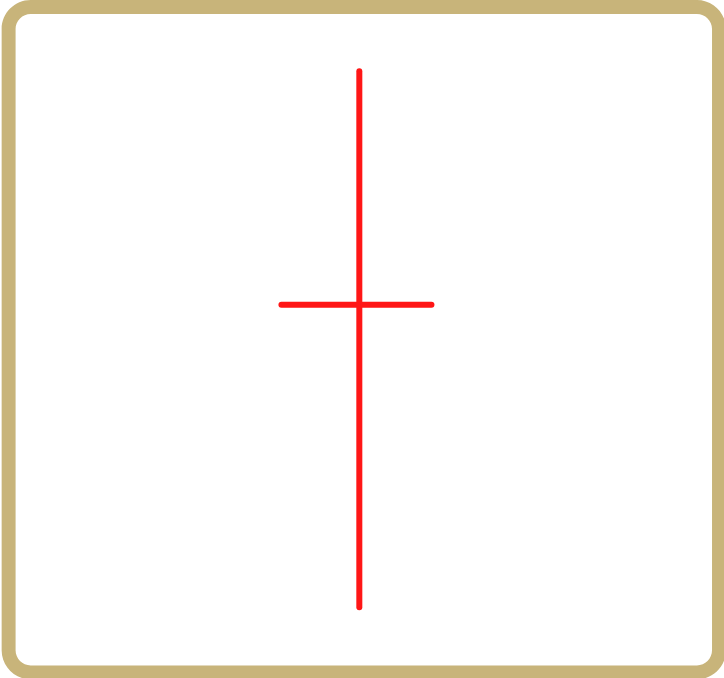
Gravestone Doji is a bearish reversal pattern. It has a very small real body. It has a very short lower shadow and a very long upper shadow. For the Gravestone Doji to be applicable the market must be in an uptrend.
Below is an example of a gravestone Doji spotted on a daily chart. The market was in a clear uptrend before the pattern appeared. After the pattern, the market reversed its direction.
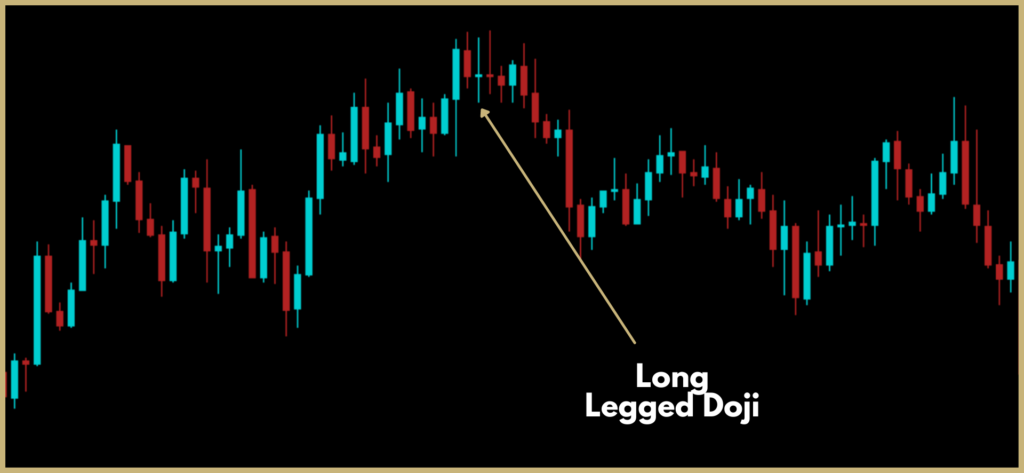
Long Legged Doji
Long-legged Doji can be a bearish or bullish reversal pattern. It has a very small real body. It has a very long lower shadow and a very long upper shadow usually of equal length. For the long-legged Doji to be applicable the market can be in an uptrend or a downtrend.
Below is an example of a Long-legged Doji spotted on a daily chart. The market was in a clear uptrend before the pattern appeared. After the pattern, the market reversed its direction.
Lesson 9: Guide to Single Candlestick Patterns
Single candlestick patterns are important to understand if you want to learn price action trading.
Shooting Star
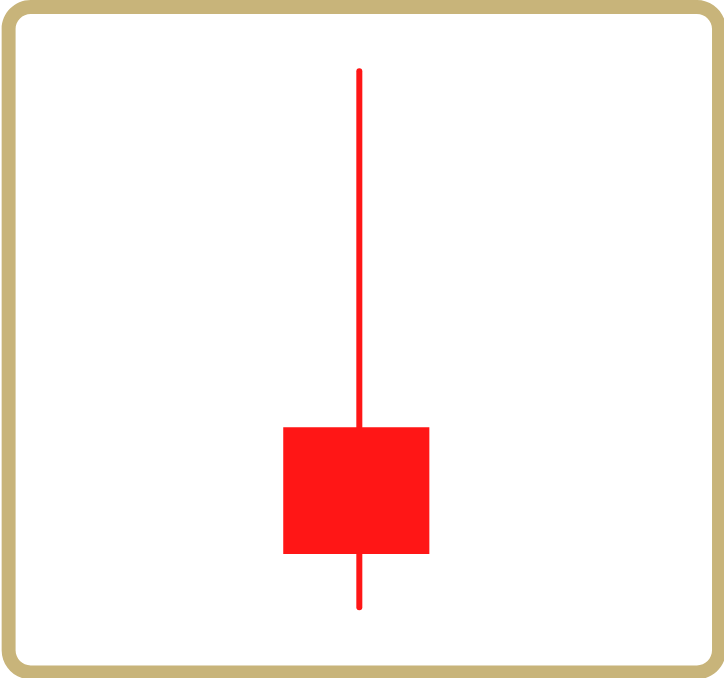
A shooting star is a bearish reversal pattern. It has a short real body, a long upper shadow, and a very short or no lower shadow. The real body is at the bottom end of the session’s candle. It is important for the upper shadow to be at least twice the size of the real body.
The color of the real body of the shooting star is not that important. For the shooting star to be applicable, the market must be in an uptrend.
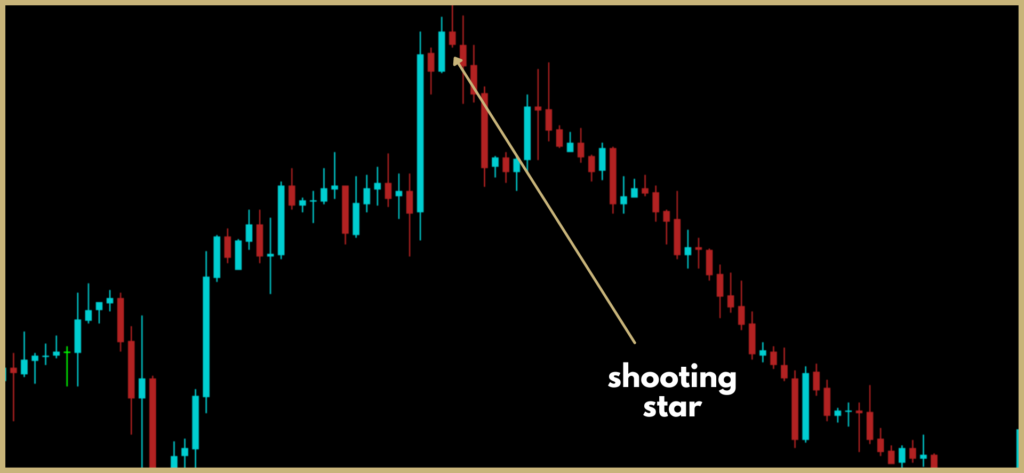
The above chart shows a shooting star on GBPUSD daily chart. The shooting star is marked and satisfies the above criteria. As you can see, the market was in a clear uptrend before the formation of the shooting star.
Hammer
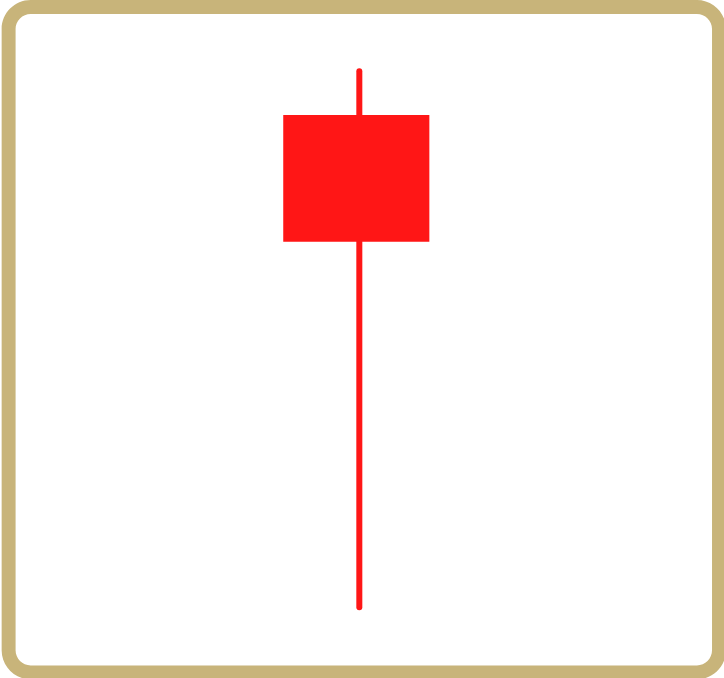
Hammer is a bullish reversal pattern. It has a short real body, a very small upper shadow, and a very long lower shadow. The real body is at the top of the pattern. The color of the pattern does not matter.
For the pattern to be applicable the market must be in a downtrend. It is also important for the lower shadow to be at least twice the size of the real body.
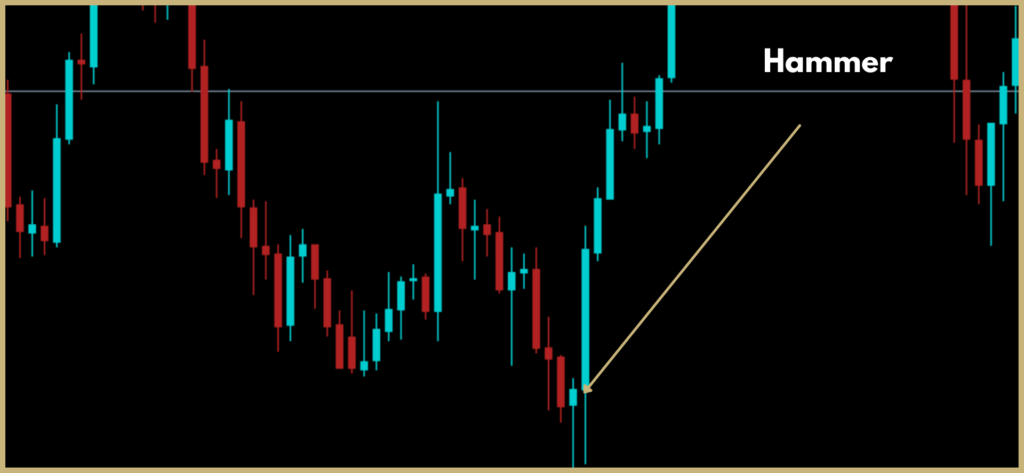
The above chart shows a hammer on AUDNZD 4-hour chart. Hammer is marked on the chart and satisfies the above criteria. As you can see, the market was in a clear downtrend before the formation of the hammer.
Inverted Hammer

Inverted Hammer is a bullish reversal pattern. It has a short real body, a very small lower shadow, and a very long upper shadow. The real body is at the bottom of the pattern. The color of the pattern does not matter.
For the pattern to be applicable the market must be in a downtrend. It is also important for the upper shadow to be at least twice the size of the real body.
Hanging Man
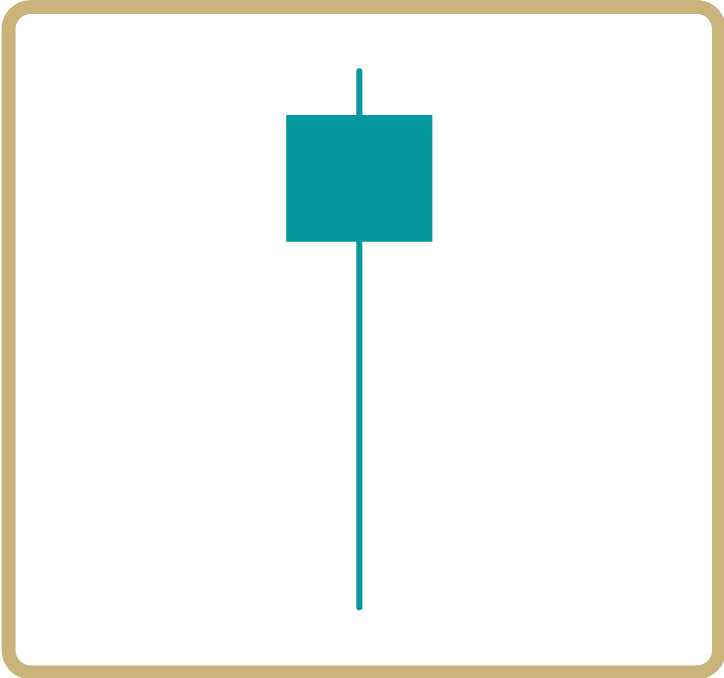
Hanging man is a bearish reversal pattern. It has a short real body, a very small upper shadow, and a very long lower shadow. The real body is at the top of the pattern. The color of the pattern does not matter.
For the pattern to be applicable the market must be in an uptrend. It is also important for the lower shadow to be at least twice the size of the real body.
Lesson 10: Guide to Double Candlestick Patterns
In this guide, we will talk about powerful double candlestick patterns that you can use to trade the forex market.
Bullish Engulfing Pattern
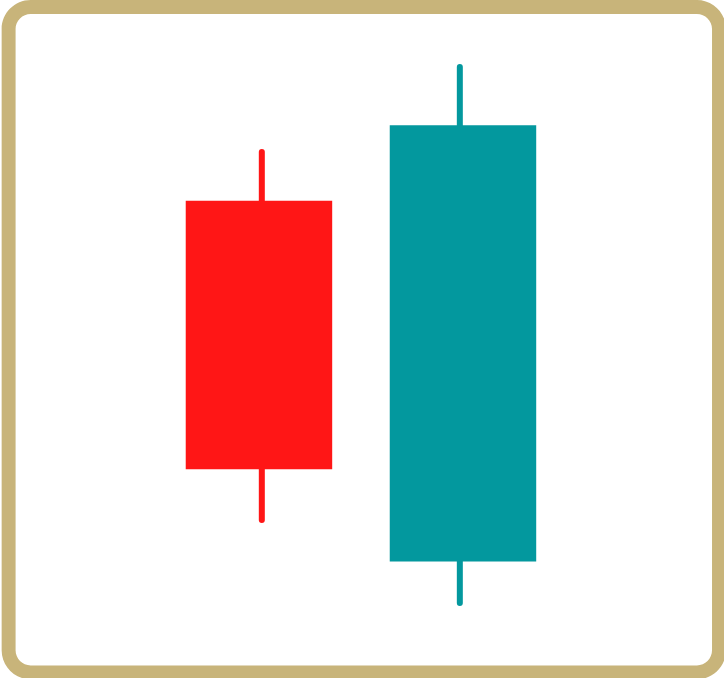
The bullish engulfing pattern is a powerful two-candle pattern. For the pattern to be valuable the market must be in a downtrend. The first candle must be red, and the second candle must be green.
The real body of the second candle should be bigger than the real body of the first candle. Traders say that the second candle engulfs the first candle, hence an engulfing pattern. The size of the shadows on either candle does not matter that much.
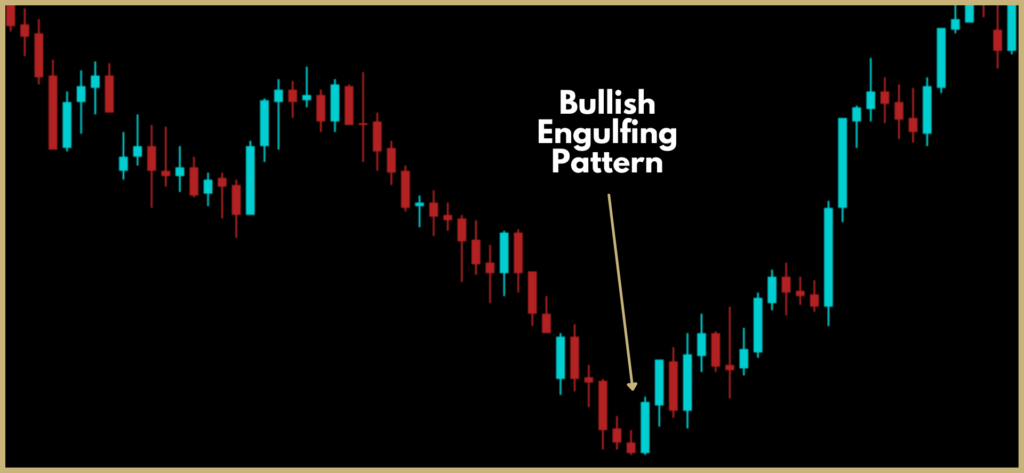
The above example shows a bullish engulfing pattern spotted on a daily chart. As you can see, there was a clear downtrend before the pattern. The pattern confirmed a reversal in the trend.
Bearish Engulfing Pattern
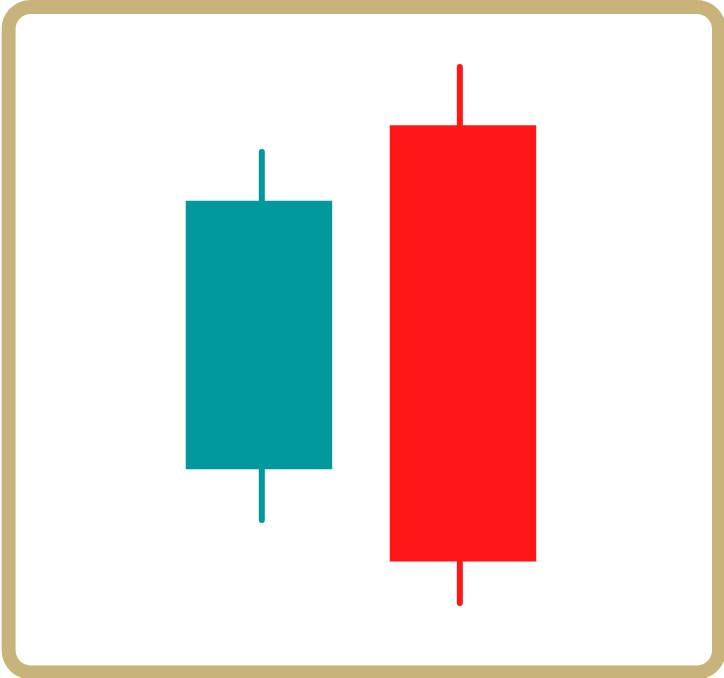
The bearish engulfing pattern is a powerful two-candle pattern. For the pattern to be valuable the market must be in an uptrend. The first candle must be green, and the second candle must be red.
The real body of the second candle should be bigger than the real body of the first candle. Traders say that the second candle engulfs the first candle, hence an engulfing pattern. The size of the shadows on either candle does not matter that much.
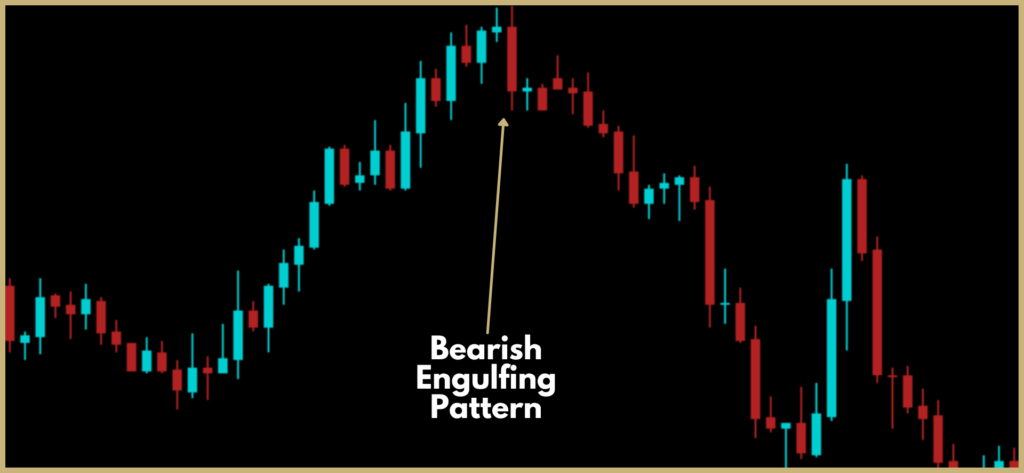
The above example shows a bearish engulfing pattern spotted on a daily chart. As you can see, there was a clear uptrend before the pattern. The pattern confirmed a reversal in the trend.
Dark Cloud Cover
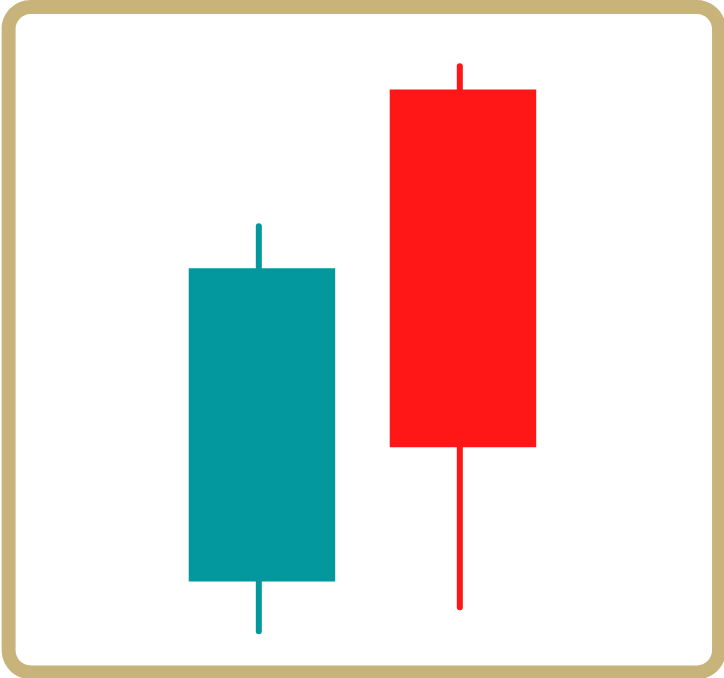
This pattern is a two-candle pattern, and it is a bearish reversal pattern. It is also called a gap pattern because there is a gap between the two candles. The first candle must be green, and the second candle must be red.
Also, for this pattern to be applicable the market must be in an uptrend. The closing price of the second candle should be in the first half of the first candle.
Rising Sun
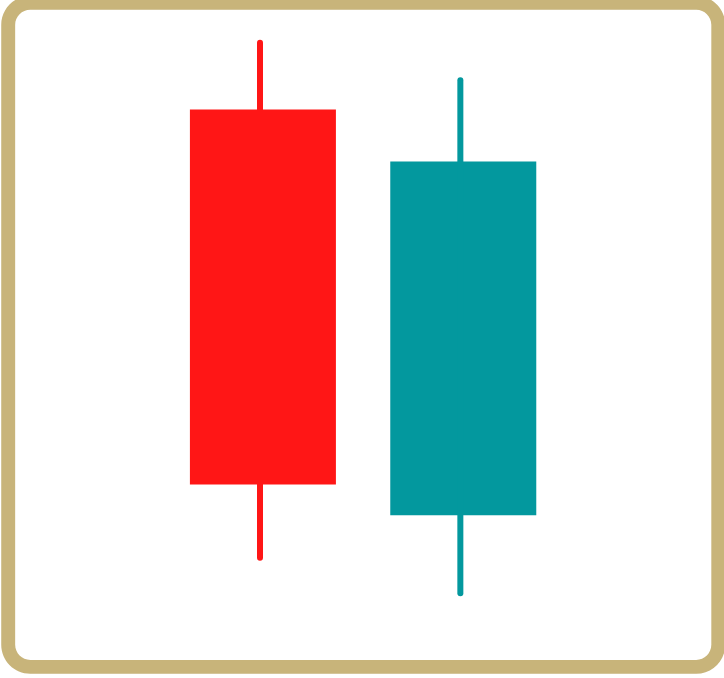
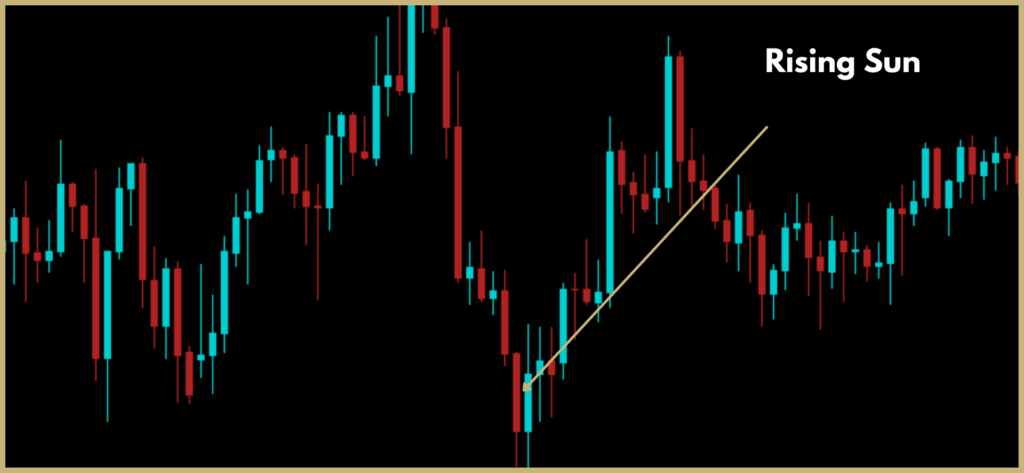
This pattern is like the dark cloud clover and this is also a gap pattern. It is also a bullish reversal pattern. The first candle must be green, and the second candle must be red. For the pattern to be applicable the market must be in a downtrend.
The closing price of the second candle should be in the second half of the first candle. The chart below shows a rising sun pattern after a downtrend. It is a powerful reversal pattern.
Tweezers Top & Tweezers Bottom
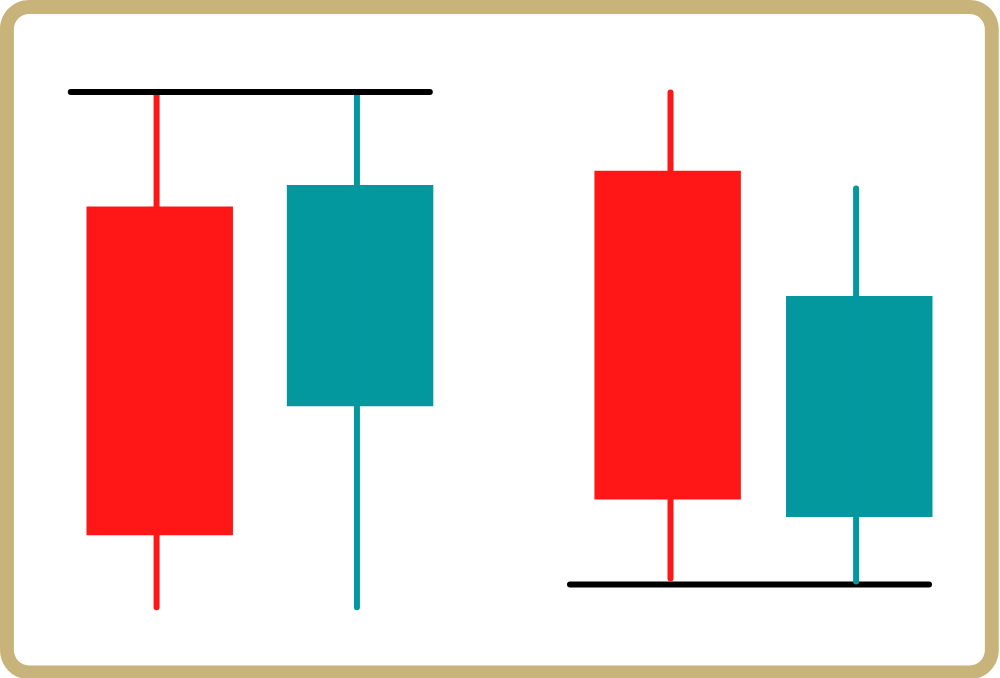
Tweezers top as shown in the image to the left forms when two consecutive upper shadows match. For the tweezer’s bottom, the two consecutive lower shadows must match.
Tweezer’s top is a bearish reversal pattern, and the tweezer’s bottom is a bullish reversal pattern. The tweezer’s top and tweezer’s bottom is a powerful pattern if they form another pattern as well. For example, the tweezer’s bottom can also form a bullish engulfing pattern.
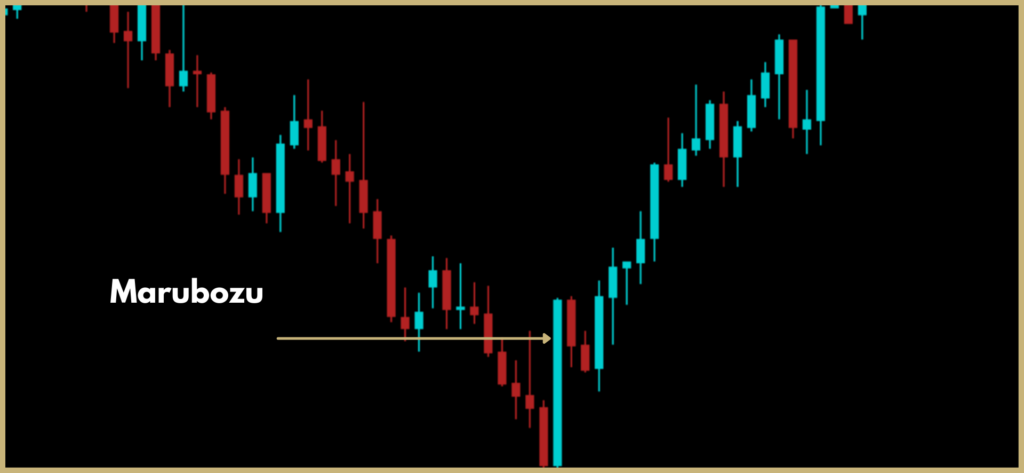
Marubozu

The green candlestick above is a bullish Marubozu and the red candlestick pattern above is a bearish Marubozu. The Marubozu candle can be used as a continuation pattern or a reversal pattern. If Marubozu appears with the trend, then it is a continuation signal. If it appears against the trend, then it is a reversal signal.
Lesson 11: Guide to Moving Average Indicator
The moving average is one of the most popular indicators used by professional traders. There are several types of moving averages, these are.
- Simple Moving Average
- Exponential Moving Average
- Weighted Moving Average
We will only discuss the simple moving average because that is the only one, we use. In our opinion, it is the best moving average indicator.
Simple Moving average (SMA)
SMA is the easiest to construct. It is calculated by averaging the closing price over a certain period. For example, if you are using the 1-hour chart, and you want a 7-period moving average. It will be using the closing price for the last 7 hours. Hence the moving average is calculated as follows.
Sample closing prices = 1.385, 1.395, 1.455, 1.375, 1.374, 1.400, 1.424

How to use SMA
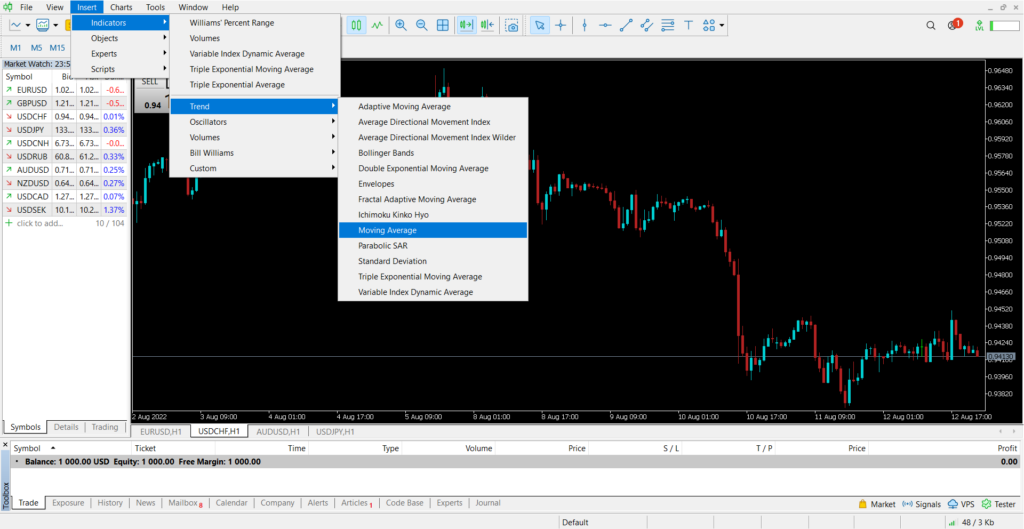
The image above shows how to add the moving average indicator in the metatrader4 platform.
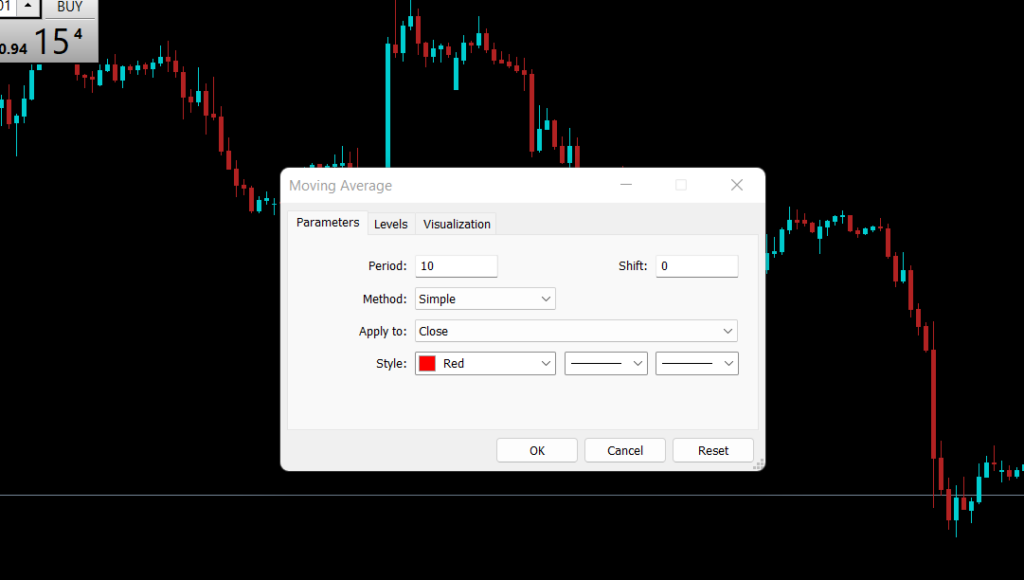
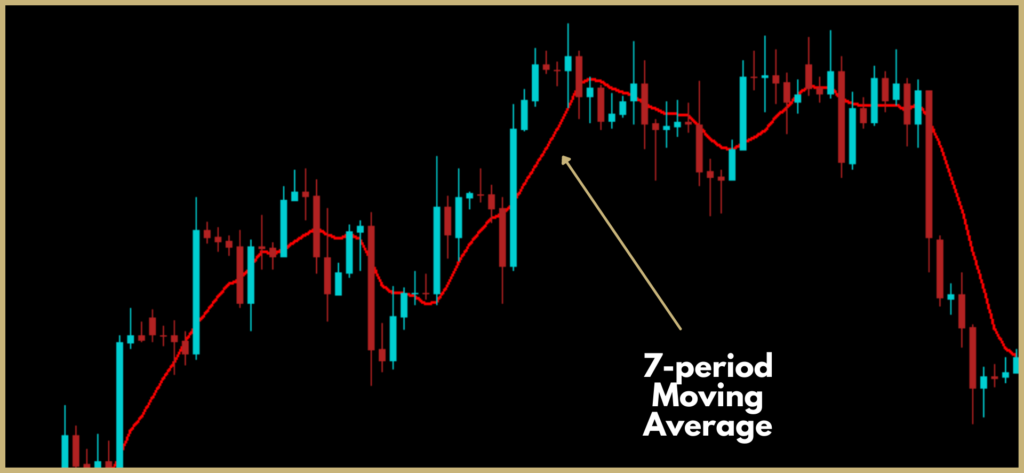
The image on the previous page shows different options to choose from for the moving average indicator. You can choose the period, the shift, the type of indicator, and the styling. The figure below shows a 7-period simple moving average being added. Remember, previously we did an example of how the moving average is calculated.
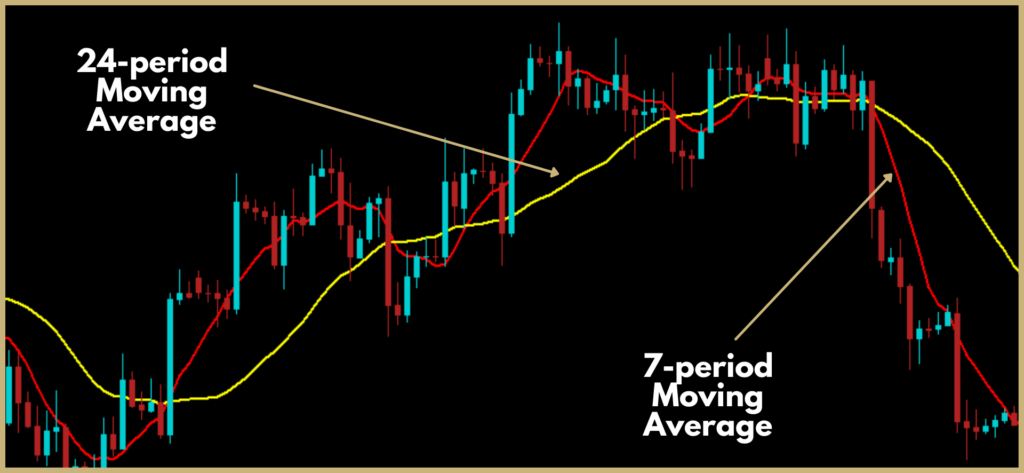
The longer the period you use for the moving average the smoother the line becomes. The chart below shows a 24-period moving average. The yellow line is the 24-period SMA and the red line is the 7-period SMA. As you can see there is a significant difference in the smoothness of the indicator.
The simplest way to use the moving average is to use it as an indication of the direction of the trend. Looking at the chart below you can see that the market is in an uptrend. The SMA makes it easier to understand the direction of the trend rather than looking at the candlesticks.
Some traders use SMA with very long periods as support and resistance levels. We personally do not use it and do not really recommend that method. We use the moving average in a different way that will get into soon.
How to Trade Using the SMA
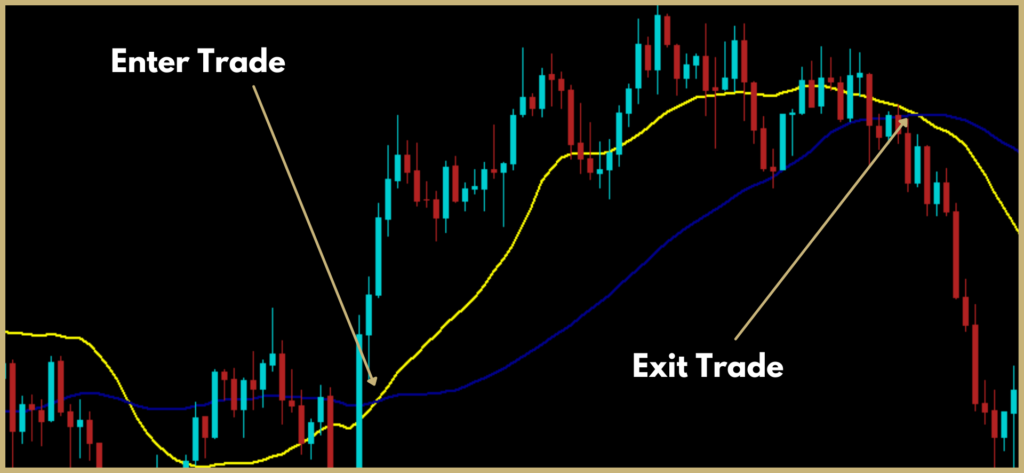
To find good trade entry points using moving averages you should add 2 different moving averages with a different period, a fast-moving average and a slow-moving average, and find the cross-over point. The most popular crossover periods are 50 and 20. The chart below shows the 2 indicators and crossover points, 20 SMA (yellow) and 50 SMA (blue).
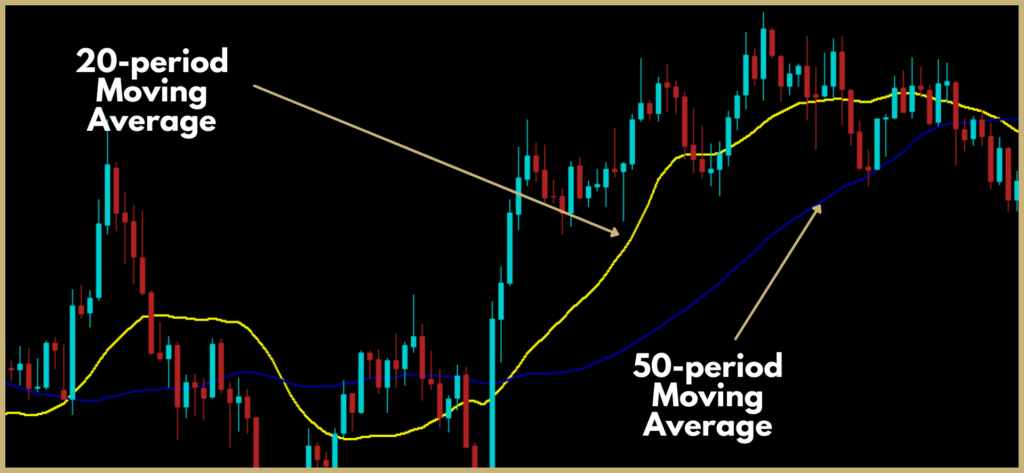
The crossover point where the yellow indicator crosses the blue indicator is a reversal in direction. For example, take the chart below. You can enter a trade at the second cross-over point and exit the trade at the third cross-over point.
Lesson 12: Relative Strength Index (RSI)
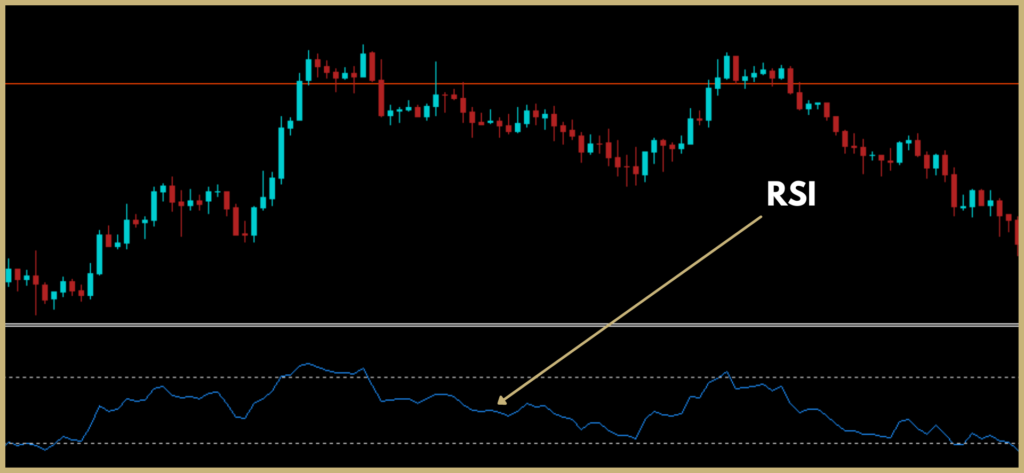
The relative strength index is shown above. It indicates whether the currency is overbought or oversold. The RSI value ranges between 0 and 100. The RSI is calculated by using the last 14 periods (candles) and taking the size of the bullish and the bearish candle. If the sizes of the bullish candles were greater then the RSI will be closer to 100. If the sizes of the bearish candles were greater then the RSI will be closer to 0.
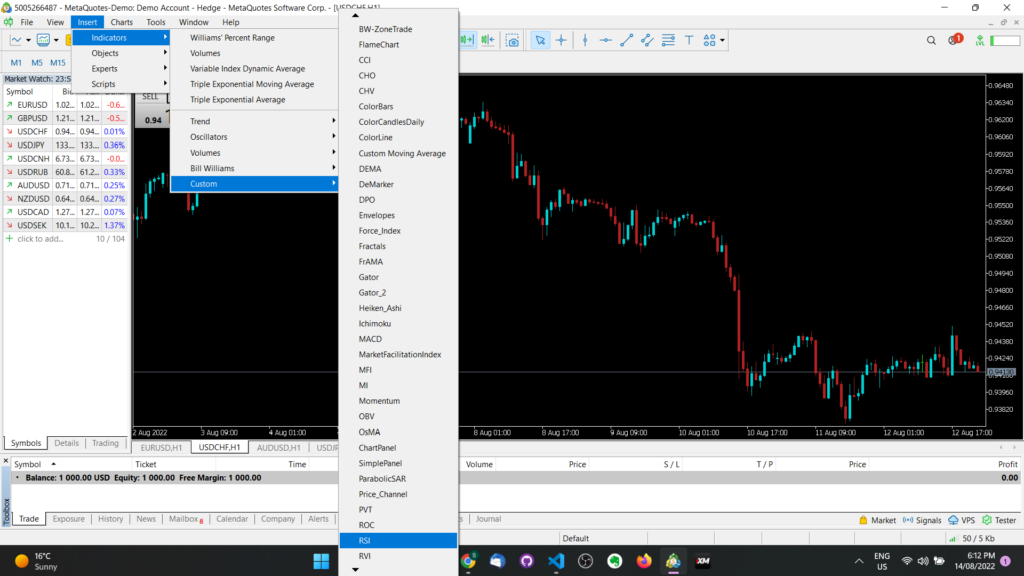
The chart above shows how to add the RSI indicator to MetaTrader 4 platform. The RSI lines are usually drawn at the 70 levels and the 30 levels. If the value of the RSI is greater than 70 then the traders consider the market to be overbought. If the RSI is lower than 30 the traders consider the market to be oversold.
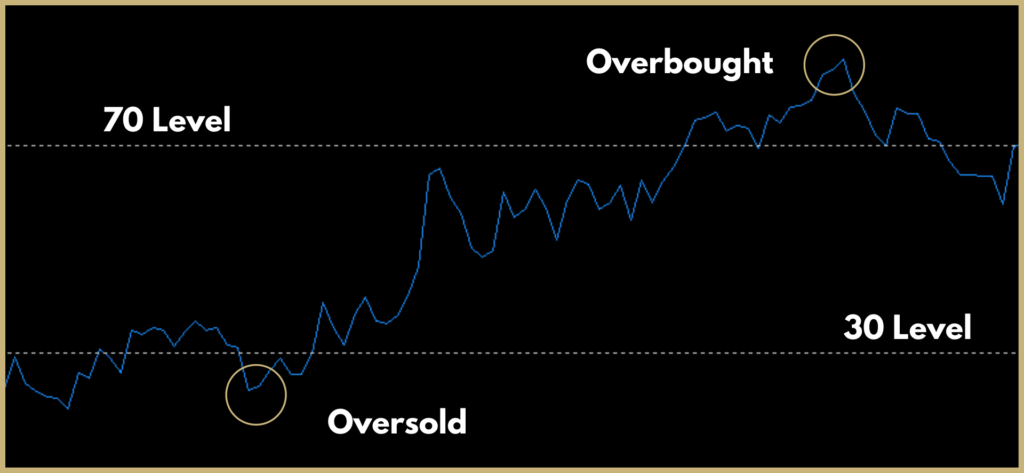
To trade with the RSI indicator, look at the point where the market becomes overbought or oversold. Then, enter the trade when the market stops becoming oversold or overbought. This doesn’t work all the time. Therefore you have to use rsi in conjunction with other methods.
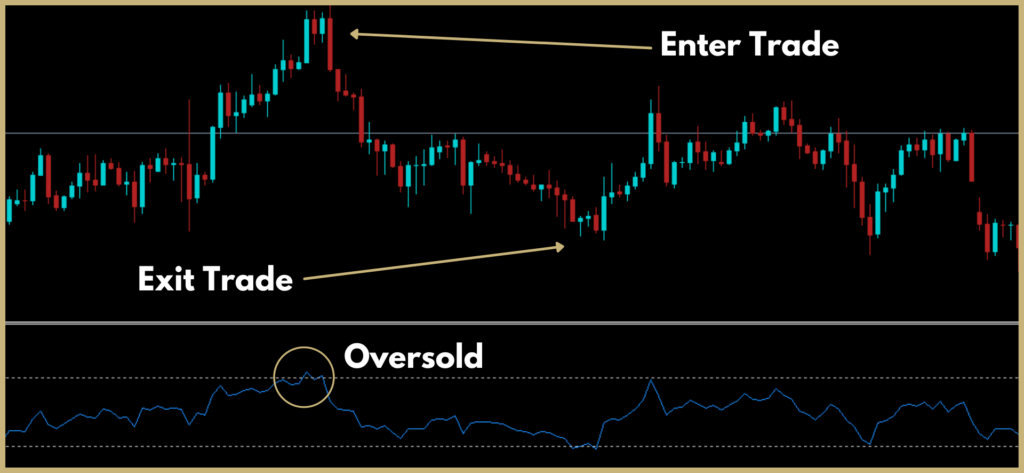
You can also use this indicator with candlestick pattern formations to trade effectively and find good trade entry points.
Lesson 13: Guide to Bollinger Bands in Forex
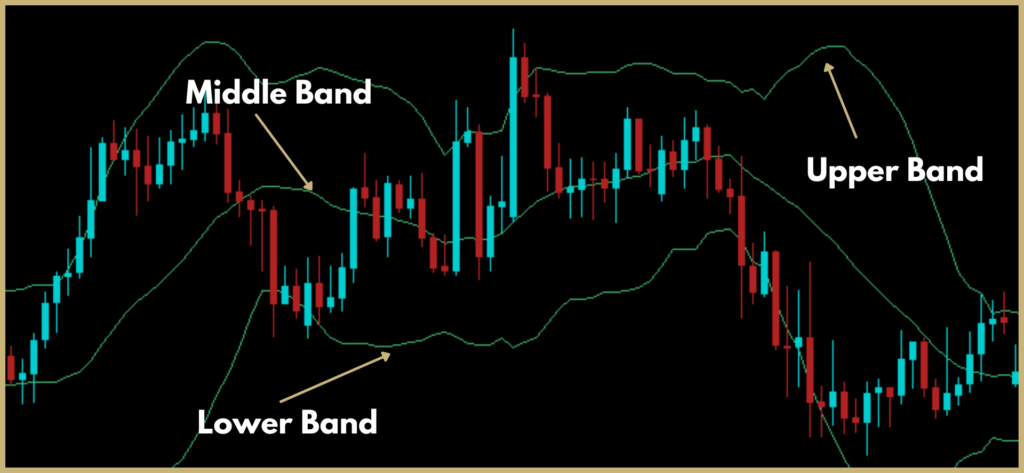
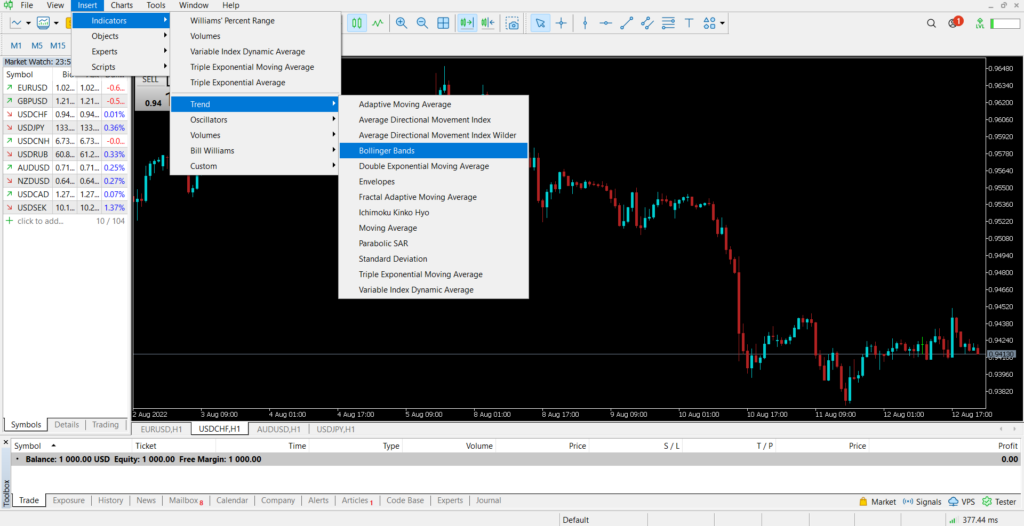
Bollinger bands are one of our favorite indicators for forex trading. The chart above shows Bollinger bands. It contains 3 different bands, a lower band, an upper band, and a middle band. The chart below shows how to add the Bollinger band indicator in the meta trader platform.
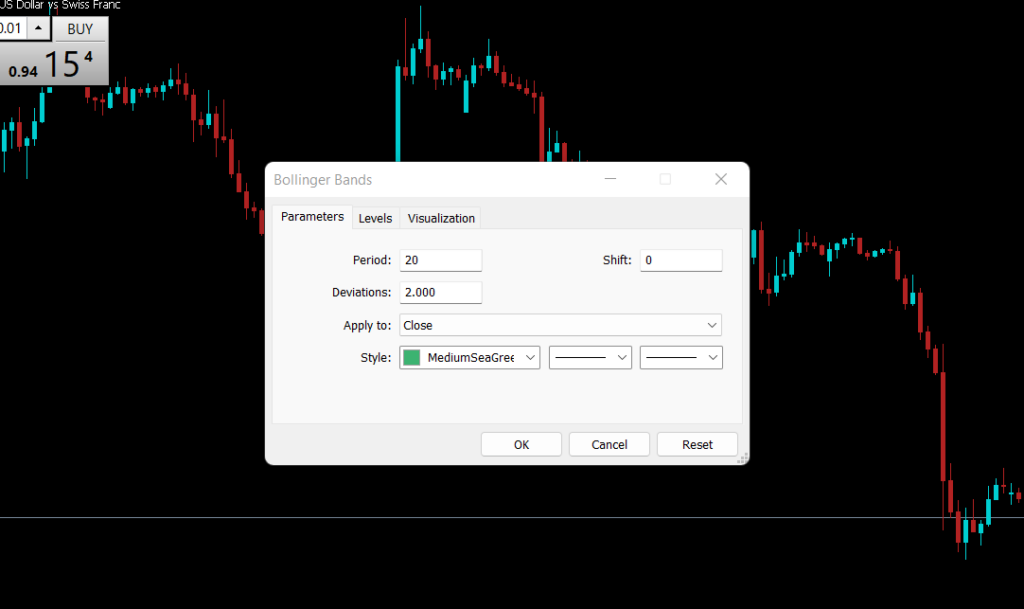
There are a few important parameters to choose from for the Bollinger band indicator, these are the period, shift, and standard deviation as shown in the image above. The Bollinger bands follow a simple bell curve as shown below.
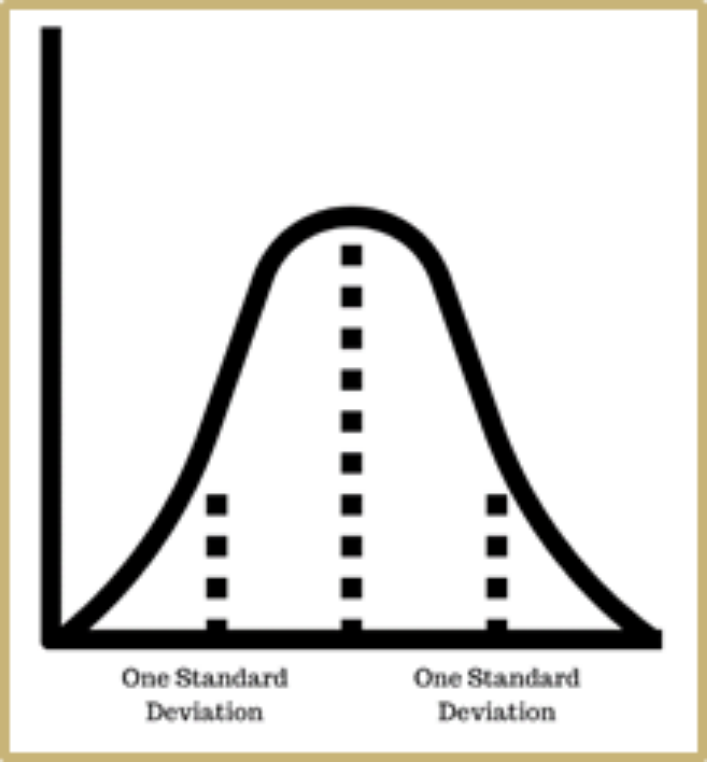
According to the bell curve, 68% of the prices are in between the lower and the upper standard deviation. The lower band is one standard deviation below and the upper band is one standard deviation above.
In the above chart, it is set to 2 standard deviations. 95% of the prices are between two standard deviations. This means that we have 95% confidence that the prices will between + or – 2 standard deviations.
To trade with Bollinger bands, you could make a buy order when the prices touch the lower band and exit the trade when the prices reach the middle band. This is possible because most of the prices stay between the 2 standard deviations. When the band touches the upper band, you can enter a sell order and exit that when it reaches the lower band.
Lesson 14: Double Tops & Bottoms
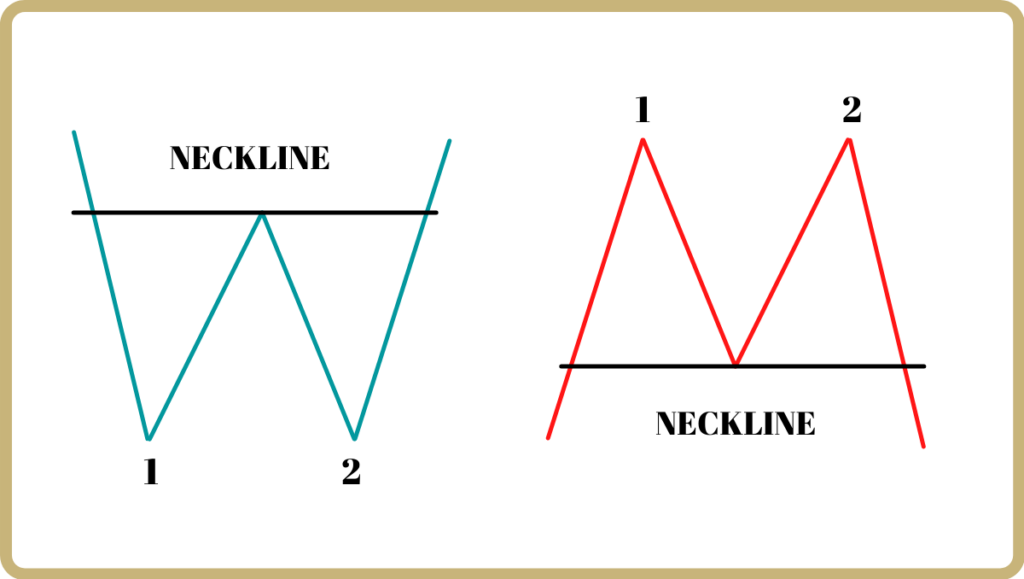
Double bottoms/double tops are a chart pattern formation as shown in the above picture. The pattern to the left shows a double bottom. The formation of a double bottom shows a strong support level at that point. You can place a buy order just above the 2nd bottom. The same concept applies to the double tops.
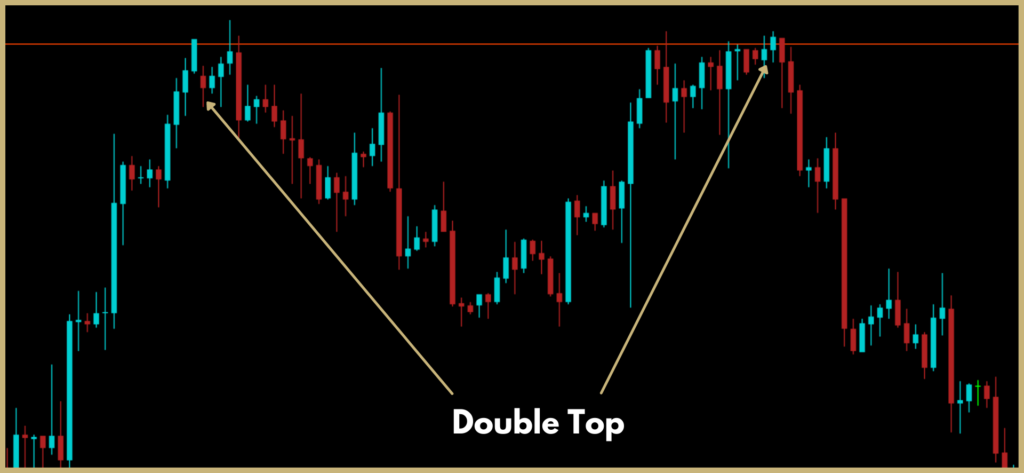
The chart above shows a double-top formation. As you can see there is strong resistance at the double top. If you placed a trade (sell order) just after the second top you could collect some pips.
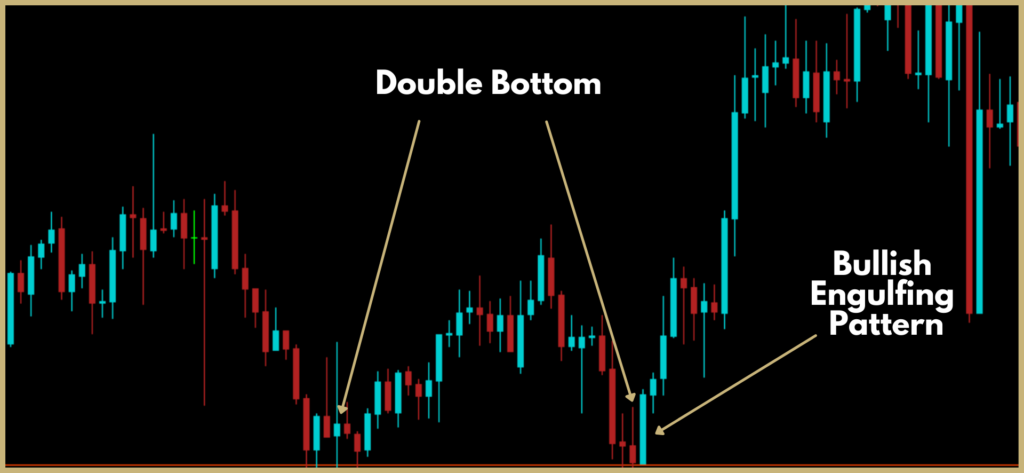
The chart below shows the formation of a double bottom followed by a bullish engulfing pattern. You could place a trade after the formation of the 2nd bottom or the bullish engulfing pattern.
Lesson 15: Pennants, Wedges and Triangle in Forex
Pennants
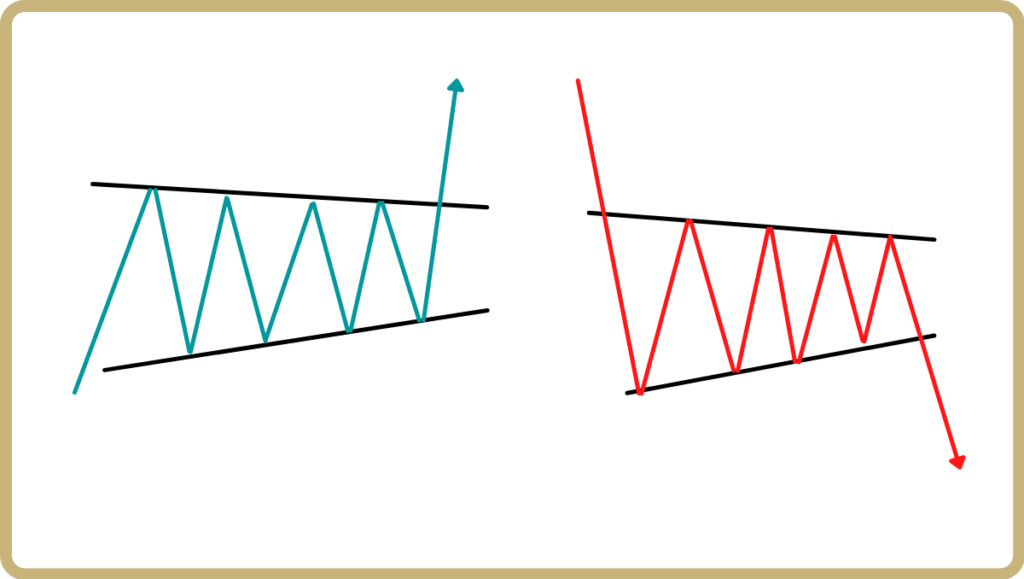
It is a pattern formed by an uptrend line and a downtrend line and it is considered a continuation pattern. There are two types of pennants, bullish pennants, and bearish pennants.
If the pennant appears after an uptrend as shown in the picture to the left it is called a bullish. If there is a downtrend then it is a bearish pennant. For the bearish pennant, we expect a breakout of the downtrend line as shown in the image. This is because the bullish pennant formed after an increase in buyers. It is the opposite of the bearish pennant.
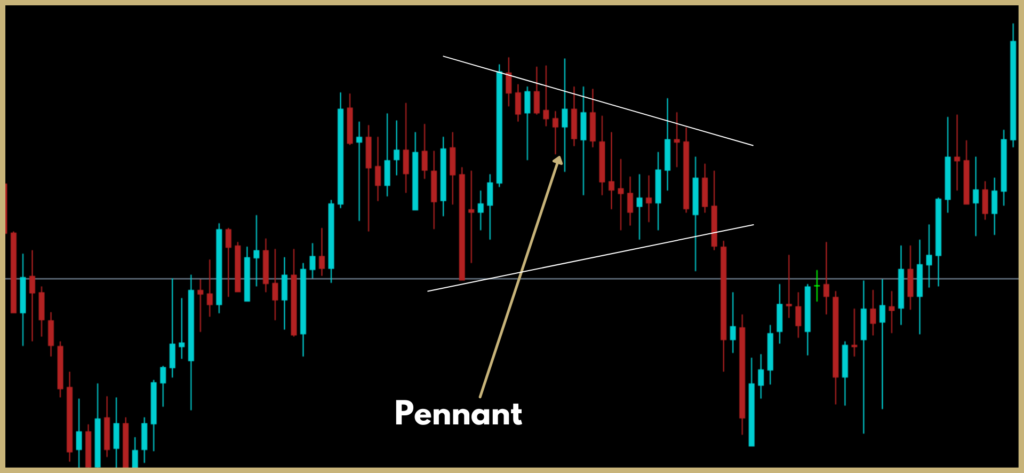
But that is not always the case, the breakout of the pennant can happen in either direction. It is always a good idea to wait till the breakout happens to enter a trade. The example below shows a pennant breakout.
Wedges
There are 2 types of wedges. They are a rising wedge and a falling wedge. There are 4 scenarios for the wedge pattern. You can have a rising wedge after an uptrend or a downtrend. And a falling wedge after an uptrend or a downtrend.
Rising/Falling Wedges
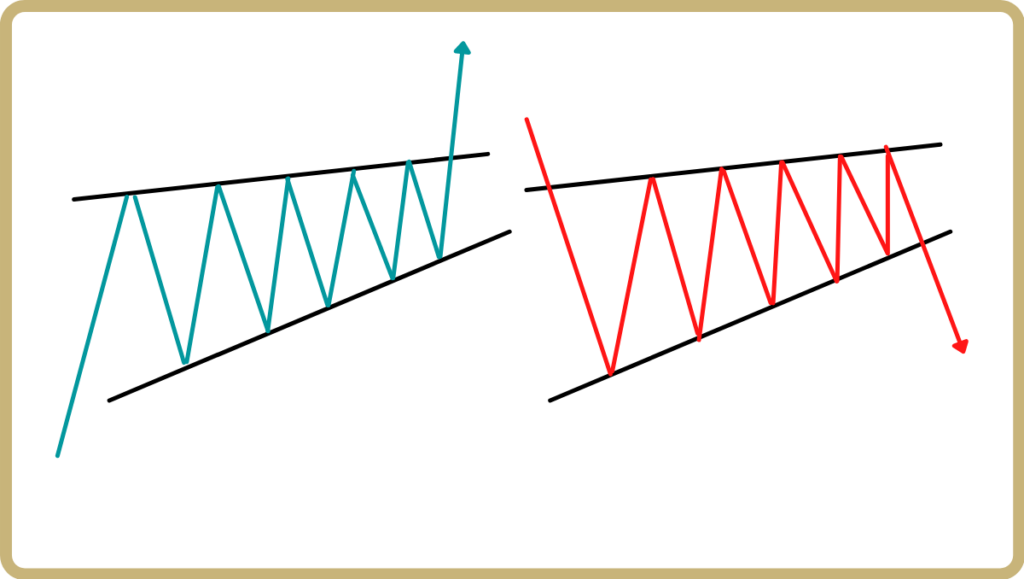
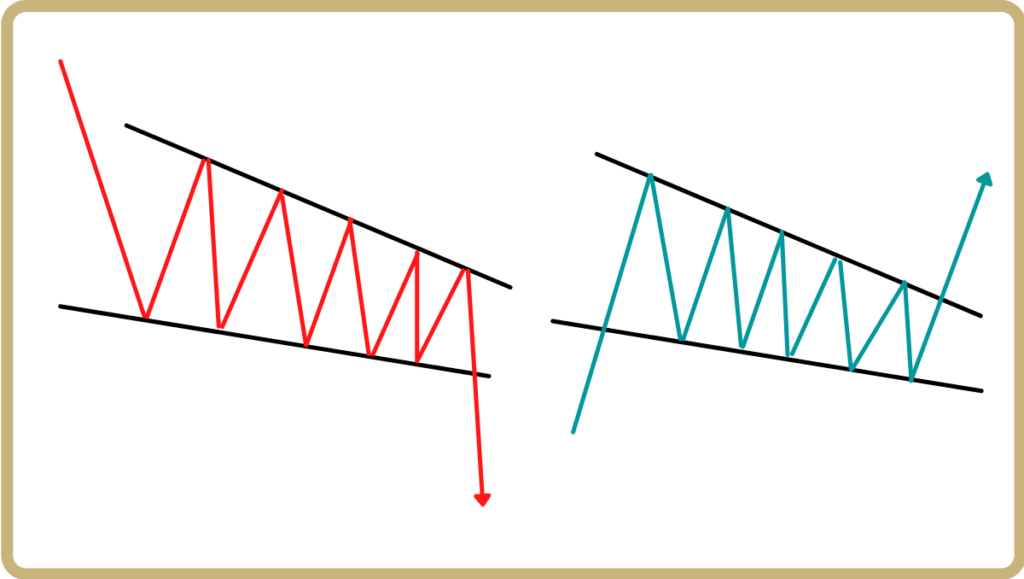
The pictures to the top show a falling wedge after an uptrend or a downtrend. Two lines form a wedge-like pattern. There is a breakout at the end of the pattern. Usually, a trader would enter the trade at the beginning of the breakout.
If you see any of the falling/rising wedge patterns above, you can expect a breakout usually in the direction of the trend. We recommend you wait for the breakout to happen and trade in that direction. You can also look for other candlestick patterns at the end of the wedge to further confirm your trade entry point.
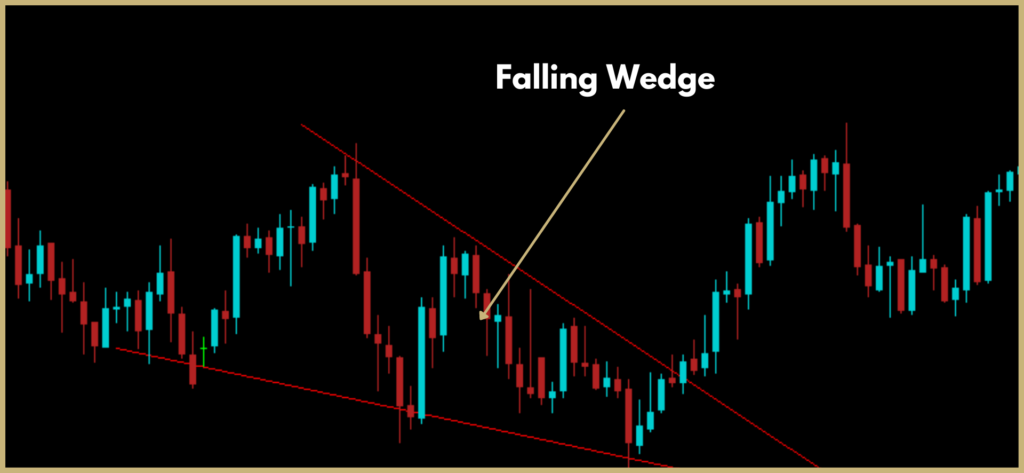
The chart above shows a falling wedge after a downtrend. You can see a breakout upwards. The breakout is also followed by a bullish engulfing pattern.
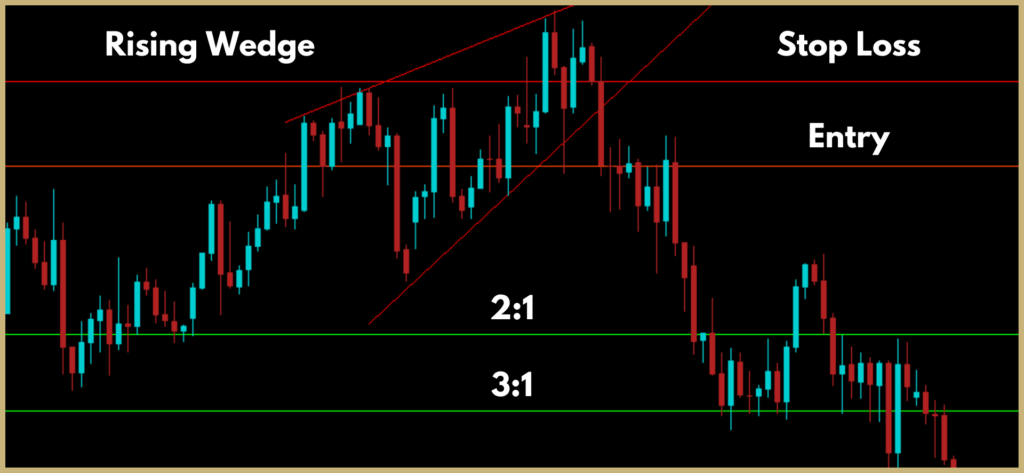
The chart below shows a rising wedge breakout. A trade could be taken after the breakout as shown below. Take profit based on your risk-to-reward ratio (2:1 or 3:1).
Triangles
- Symmetrical Triangle
- Ascending Triangle
- Descending Triangle
Symmetrical Triangle
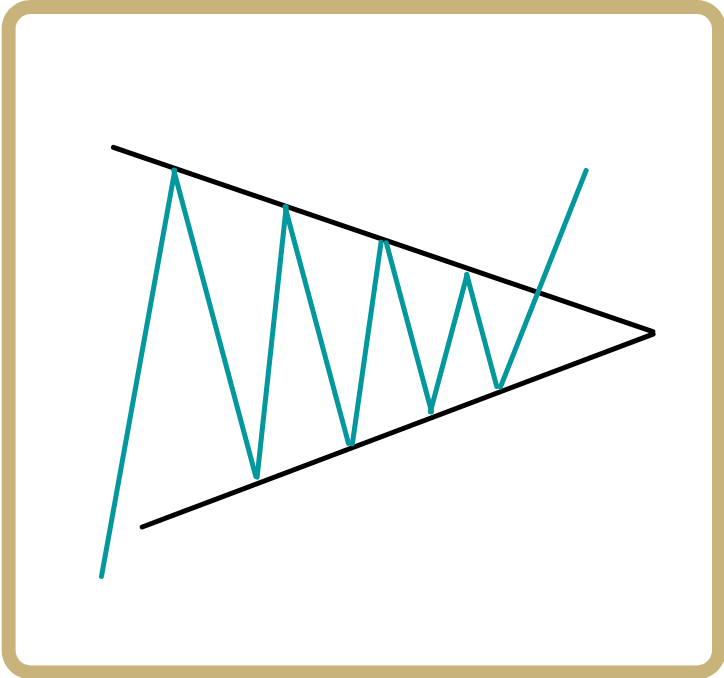
The symmetrical triangle is formed by an uptrend line and a downtrend line. Usually, the triangle pattern is a continuation pattern.
This means, that if the market is in a downtrend you will take a short position and if the market is in an uptrend you will take a long position.
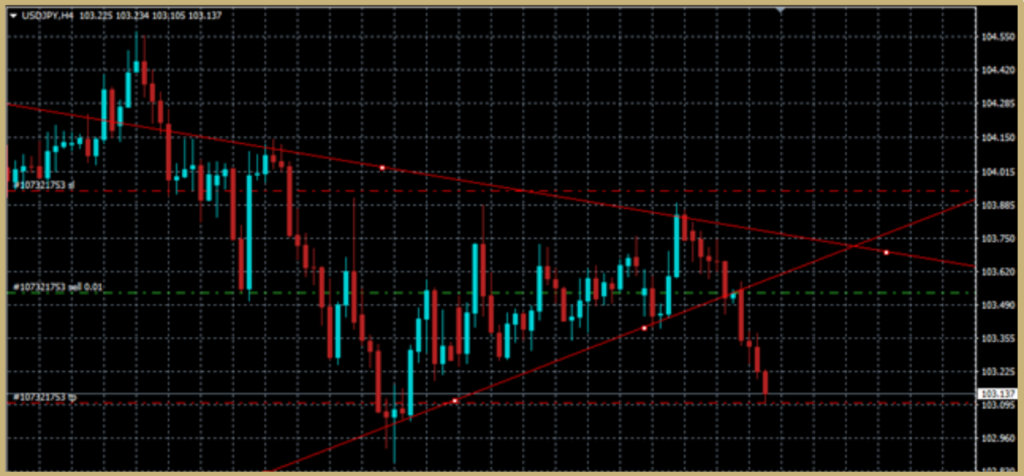
The chart below shows a trade taken using a symmetrical triangle. Before the formation of the triangle, the market was in a downtrend, therefore we expected a breakout downwards at the end of the triangle.
Ascending Triangle
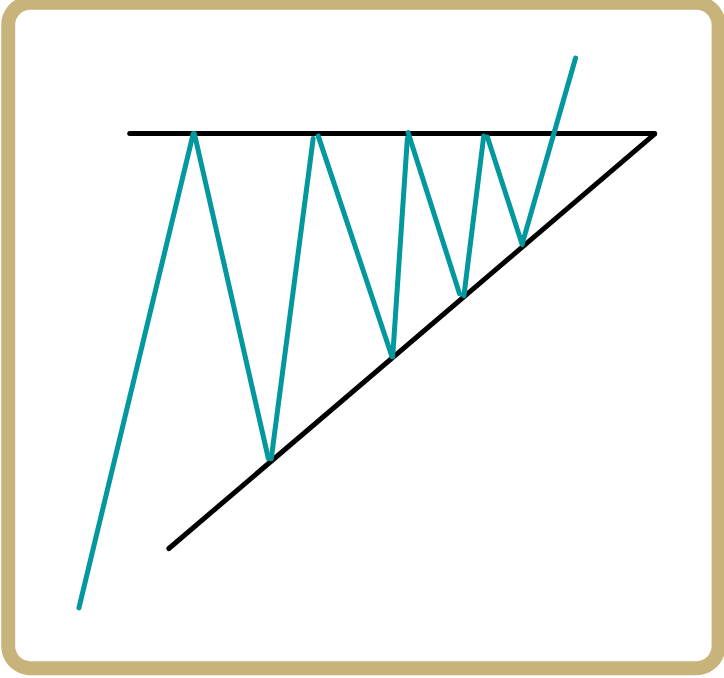
The ascending triangle is formed by an uptrend line and a horizontal line. Usually, the triangle pattern is a continuation pattern, but it is not always the case.
But there will always be a breakout at the end of the triangle. In most cases it will be upward but not all the time. We recommend you wait for it to break out before placing an order.
Descending Triangle
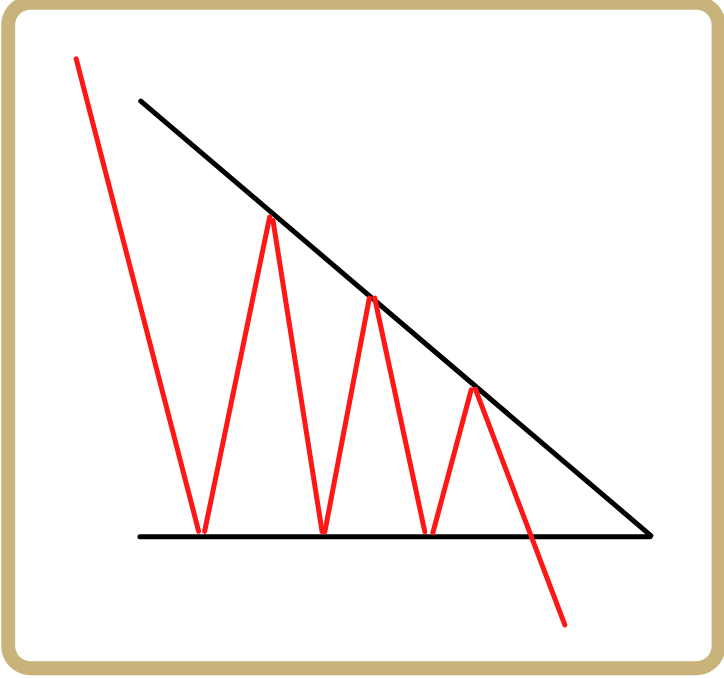
The descending triangle is formed by a downtrend line and a horizontal line. Usually, this triangle pattern is also a continuation pattern, but it is not always the case.
But there will always be a breakout at the end of the triangle. In most cases it will be downward but not all the time. We recommend you wait for it to break out before placing an order.
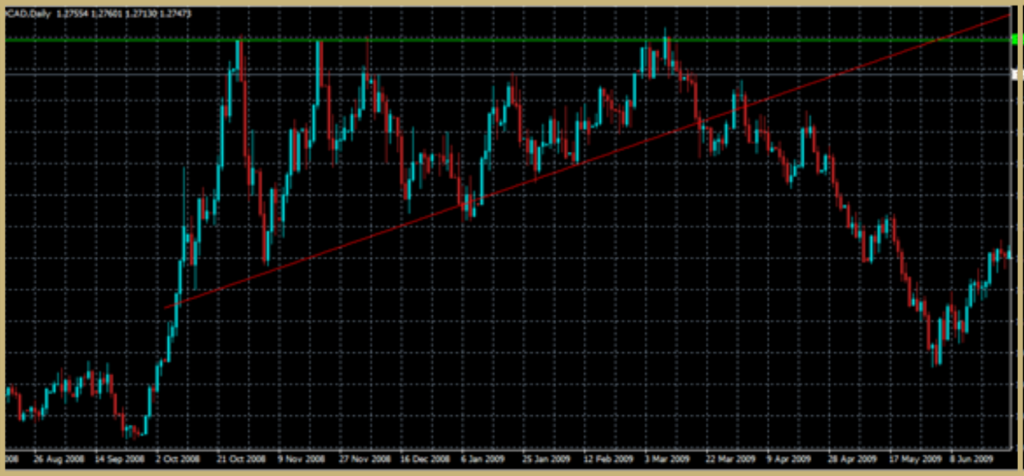
The chart above shows an ascending triangle formation after an uptrend. In this case, the trend breaks out downwards. This is a good point to enter a short position in the market.
Lesson 16: Entry points, take profit, and stop loss in Forex Trading
Trade Entry Points
Where you enter a trade depends on the strategy you trade with. If you trade reversals you need to look for reversal price action or an indication of reversal with a technical indicator. But if you are a trend trader, you need to look for continuation patterns.
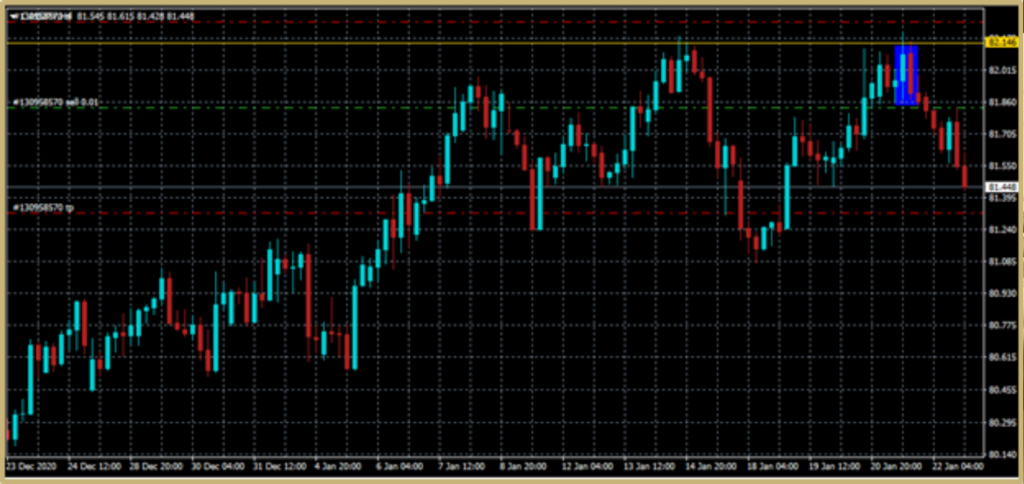
The chart above shows a trade entered. The trade was entered after a double top formation alongside a bearish engulfing candle. Usually, it is best to enter a trade after you confirm the reversal of the trend.
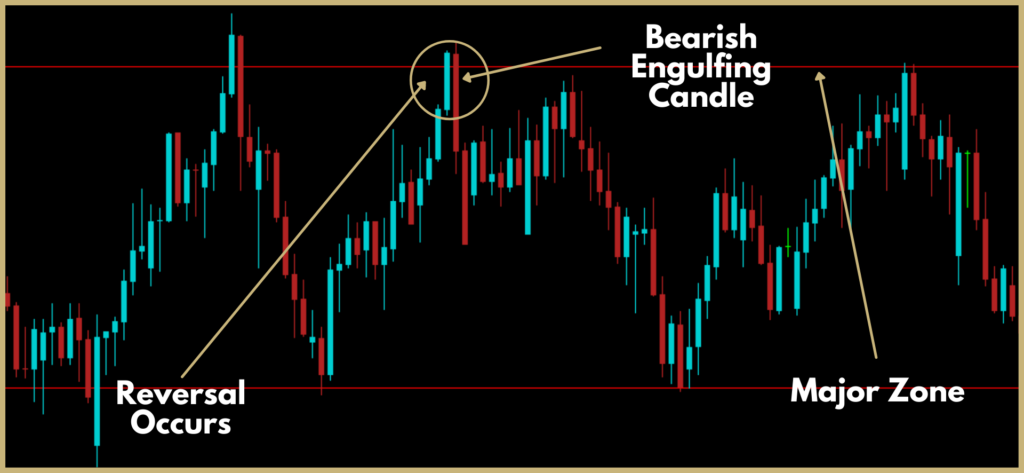
Also, an important thing to note is that the reversal patterns are stronger in major zones. If you cannot remember how to find zones, read the technical analysis section in the basic guide.
Now that you know how to look for entry points, we will now look at two very important things, placing the stop loss and taking a profit.
Placing Stop Loss and Take Profit
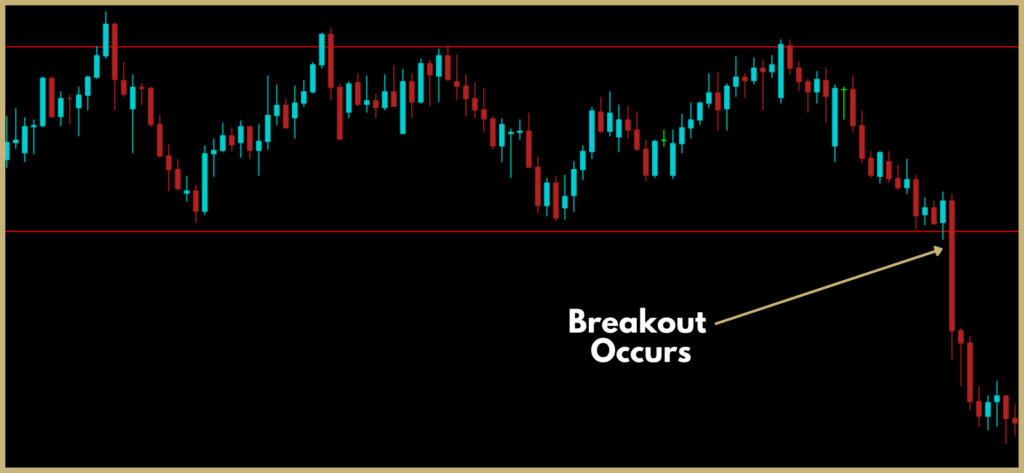
Now, let’s look at another example. The chart below shows a horizontal channel breakout. For this kind of setup, it’s always best to wait for the breakout to happen before entering a trade.
It is very important to understand how to place a stop loss. It is advised that you should never trade without a stop loss. Stop loss prevents you from losing a lot of money.
The stop loss is placed depending on your risk-to-reward ratio. Also, it is placed in the opposite direction to your trade. This prevents you from losing a lot of money if the trade does not go in the direction you expected it to go. If the market goes in the opposite direction it stops at the stop loss.
Let’s look at an example of placing the stop loss and take profit.
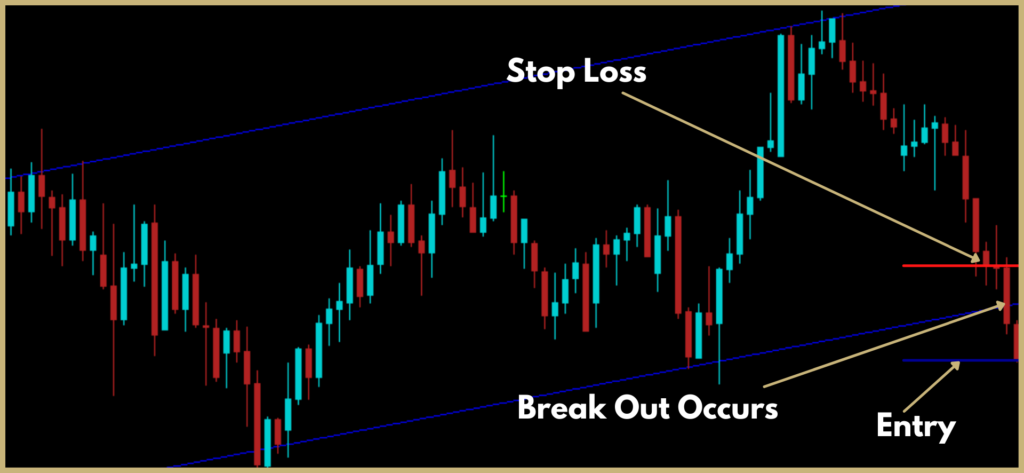
As you can see in the above chart a breakout occurs from an up channel. The breakout occurs with strong bullish candles. The stop loss and entry points are marked in the chart.
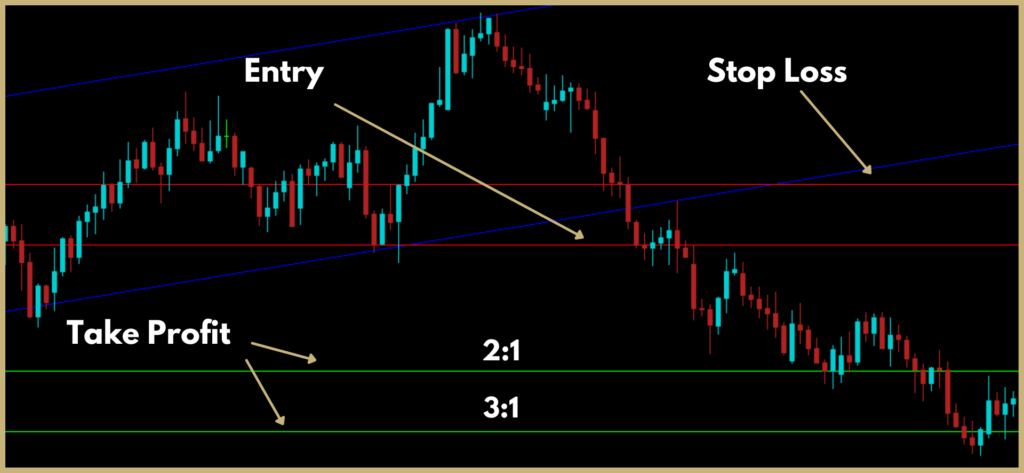
The take profit can be placed according to your risk-to-reward ratio. We have marked both the 3:1 and 2:1 risk-to-reward ratios.
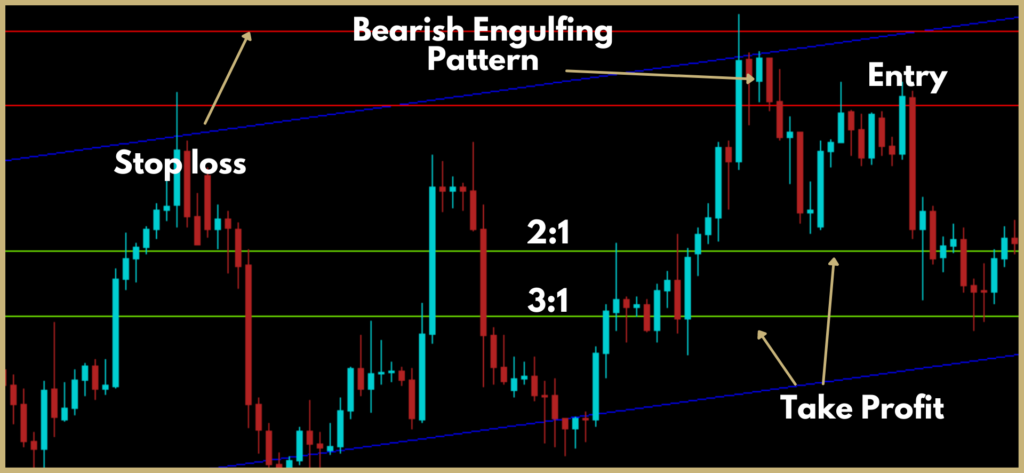
Now let’s look at another example. The chart below shows another up channel. This time we will be trading the reversal. As you can see there is a formation of a bearish engulfing pattern on the resistance.
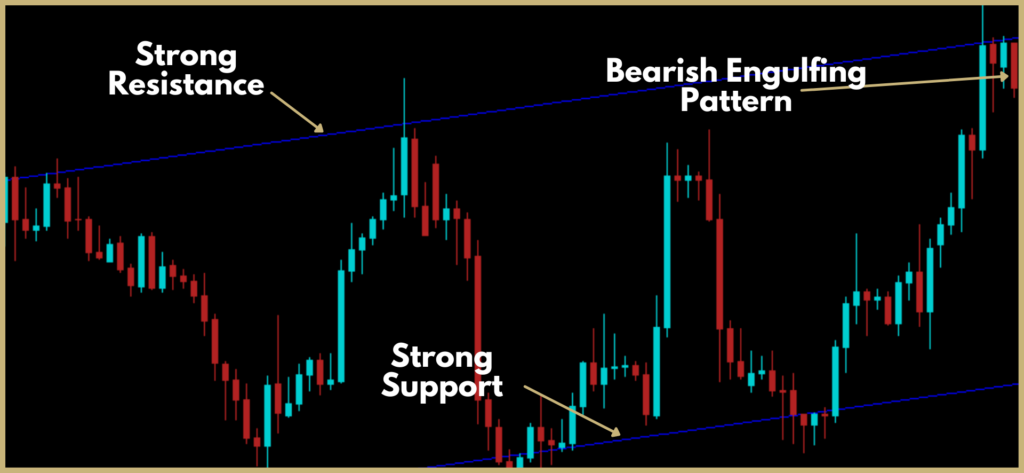
As you can see you can place the stop loss a bit above the engulfing candle and take a profit based on your risk-to-reward ratio.
Lesson 17: Building Your Own Strategy, Back Testing and Tips
Building Your Own Forex Trading Strategy
Great! If you have reached this part of this guide and if you did not skip any part, you will have all the knowledge you need to become a highly profitable trader
As discussed, there are 3 important methods to develop your profitable trading strategy. These are,
- Candlestick Patterns
- Chart Patterns
- Technical Indicators
But what do you use? Simply the things you really understand. Also, your strategy should be based on the questions below. Make sure to answer all of them.

Do you prefer trader reversals? If so, you need to master reversal candlestick patterns.
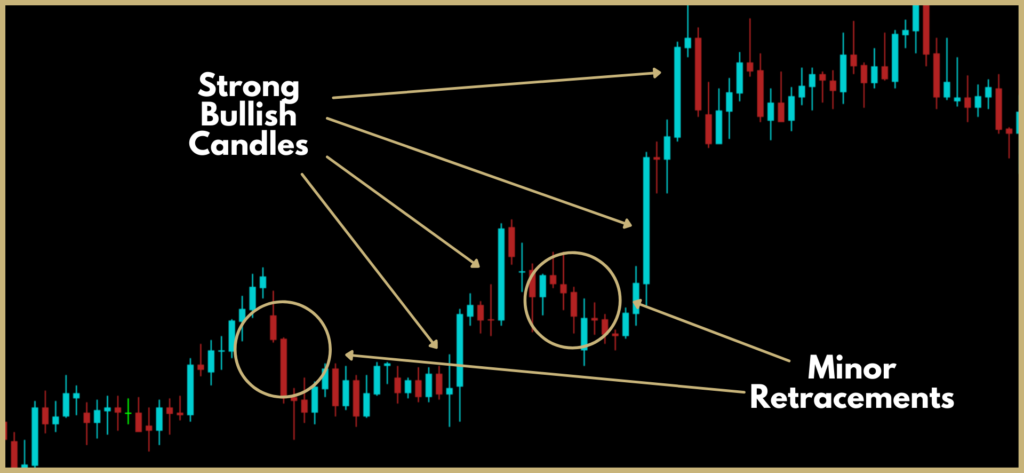
Do you prefer to trade with the trend? If so, you need to master continuation patterns.
Do you prefer to trade the breakout? If so, you need to master breakout patterns.
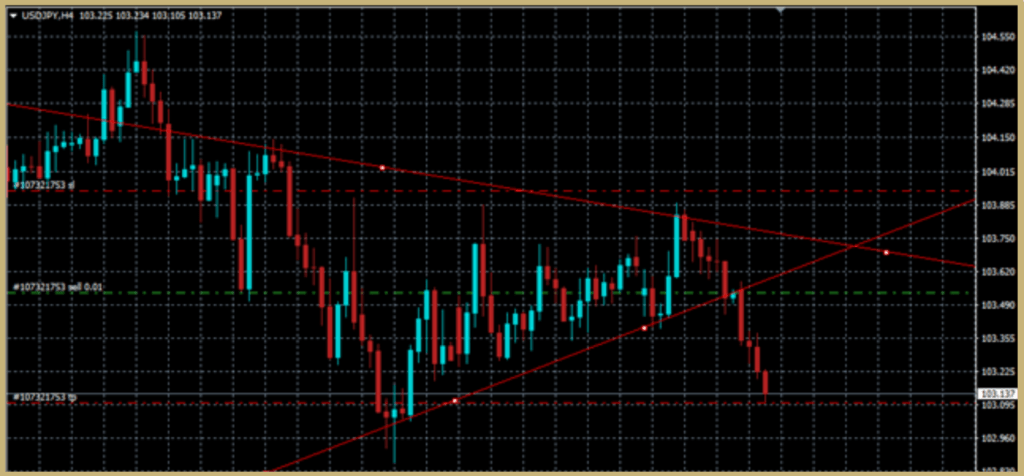
Of course, you can trade multiple strategies. You can trade using a trend trading strategy in combination with a reversal strategy.
Here is our recommendation. Choose two strategies and 1 technical indicator and then back-test it. We will talk more about backtesting in the next section.
Back Testing and Why it is Important
Backtesting is simply taking your forex trading strategy and testing it in the market with its previous data. This is very important to do if you want to become a profitable trader. Also, this is a great way to test your trading strategy and build confidence in it. There are several software that you can use for backtesting. You can backtest in MT5, trading view, or use popular backtesting software like forex tester. Forex tester is the best backtesting software out there. We recommend you get it.
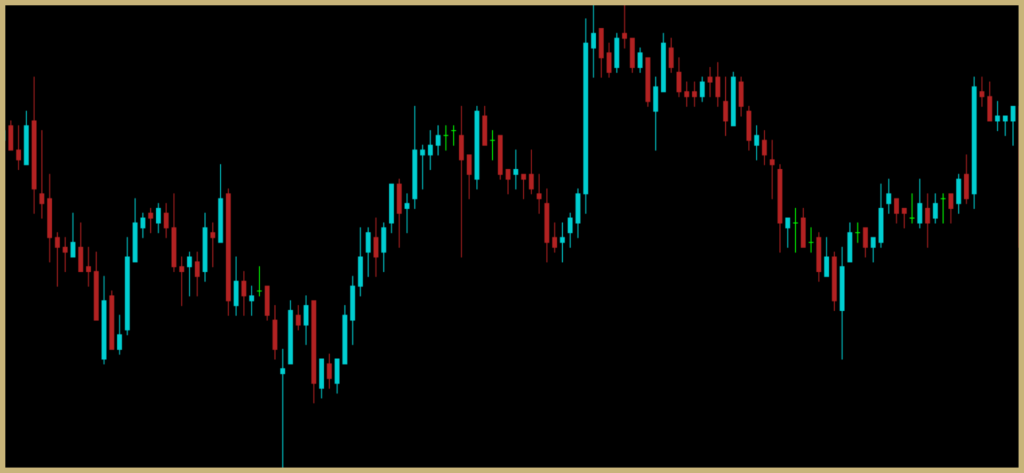
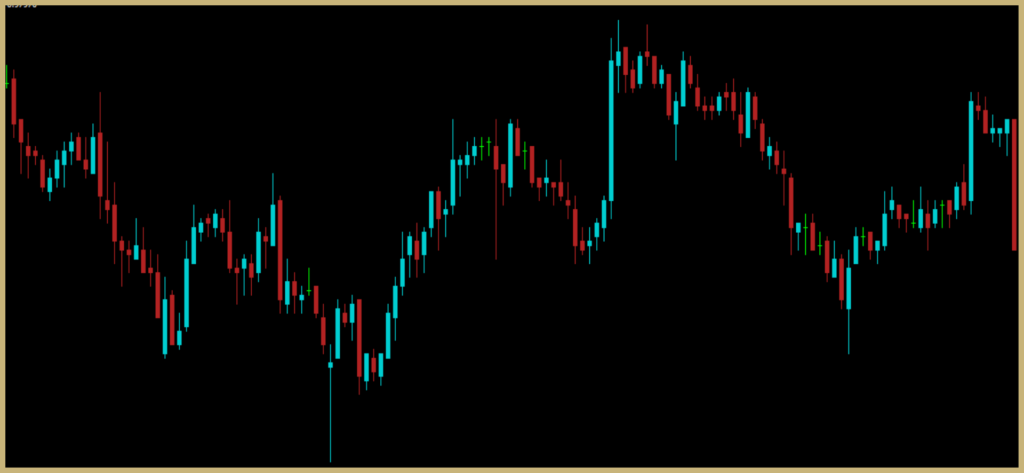
But if you don’t want to pay for the forex tester, you can always backtest on MetaTrader 4 or 5 for free. Of course, it’s not as good as the forex tester for backtesting but you can still make it work. To backtest on MetaTrader, disable the “Scroll to the end ” button as shown below (Circled in yellow).

Then, go back to the charts for your desired year. Then you can press the function key + F12 key to move your charts forward one candlestick at a time. The two charts below show before pressing the F12 key and after you pressed the F12 key.
Do you really want to be a successful trader? If you really want to, take all the strategies you learn in this guide 1 by 1 and trade using each strategy for at least 5 years going back in the chart 1 candlestick at a time.
This will help you choose the best strategy for you and master that strategy. Also, make sure to journal your backtests in a trading journal so you can easily analyze their profitability.
Tips and Advice
Forex trading is simple but on easy. The key to becoming a successful trader is to have 1-2 really good strategies, proper risk management, and the right mindset. If you have all these 3 things you will become successful.
4 Tips from Pro Traders
1. Do not risk too much money per trade. It is advisable that you risk 1-2% of your capital for each trade.
2. Always track your trades in your trading journal. It will show you how profitable is your trading strategy.
3. Plan your trading goals. Stick to your plan.
4. Treat trading as a business. Commit at least 2 hours per day to trade.
