In this article, we will talk about how to use the Fibonacci retracement to enter trades in the forex market.
Fibonacci retracements are great for entering trades but most new traders make a big mistake when trying to use Fibonacci retracement levels. We will talk about this later in the article. First, let’s look at what Fibonacci retracements are.
What is the Fibonacci Retracement?
Fibonacci retracements are simply based on the Fibonacci sequence. The Fibonacci sequence is based on a golden ratio. Each of these Fibonacci retracement levels is associated with a percentage.
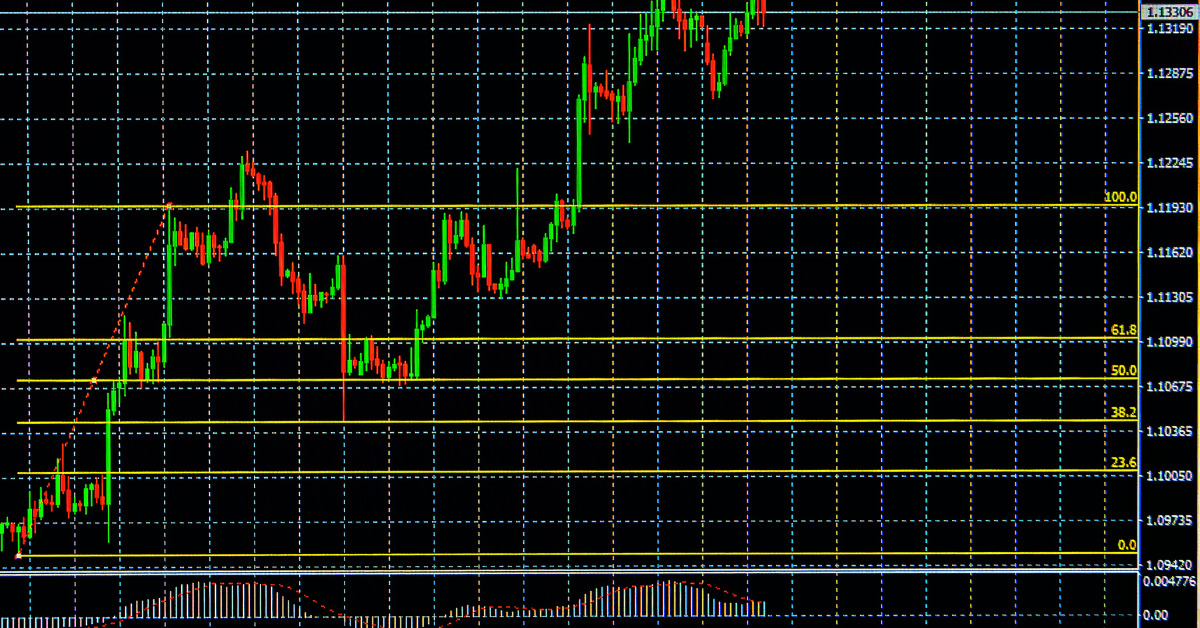
The most common Fibonacci retracement levels are 0%, 23.6%, 38.2%, 50%, 61.8%, and 100%. Now, 50% is also used by traders even though it doesn’t exactly come from the Fibonacci sequence.
In the next section, we will look at how to draw the Fibonacci retracement levels and how to enter a trade using the Fibonacci retracement levels.
Using Fibonacci Retracement to Enter a Trade
Now, let’s deep dive into how to use the Fibonacci retracements to enter a trade.
The key to trading with Fibonacci retracement is to understand the pullbacks and the rallies in the market. When there is a pullback in the market, it is called a retracement. That’s what these Fibonacci retracements indicate, “the possible pullbacks”.
So what do these pullbacks mean? It means that there is a chance that the market will reverse after a pullback in the original trending direction.
To draw a Fibonacci retracement, you first need to find a swing low and a swing high point in a trend. In your preferred trading platform (we are using the XM trading platform), you can draw the Fibonacci retracement line between the swing low position and the swing high position.
Simply, the swing low position is where there is a really low point. And the swing high position is where there is a really high point as shown in the chart below.
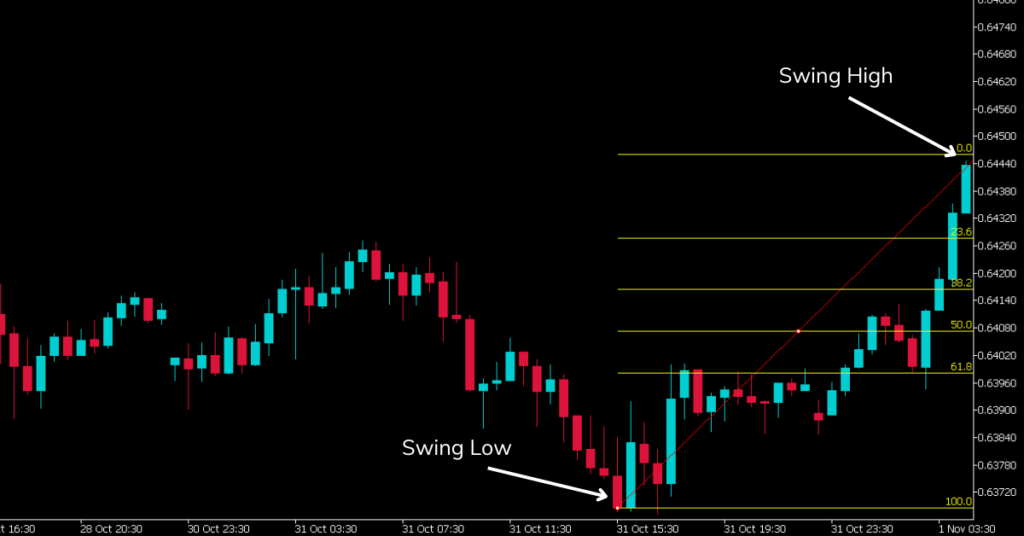
The horizontal lines are called the Fibonacci retracement levels. These Fibonacci retracement levels are automatically calculated by the trading platform you are using.
To use the Fibonacci retracements to enter a trade you need to wait till there is a pullback towards a Fibonacci level. The most used Fibonacci levels by pro traders are 61.8 %, 50.0%, and 38.2%. These are the levels that the market is most likely to pull back to and reverse from.
Now, while the market retracement to one of the 3 Fibonacci levels is an indication that the market will reverse, you should not solely rely on this to enter a trade. You must use other trading strategies to confirm the reversals.
Remember the big mistake that traders make that we talked about at the beginning of this article. Well, it is this, solely relying on the Fibonacci retracement levels for reversal confirmation.
You can use something like the supply and demand strategy to further confirm the reversal. This is not the only way but it is one of our favourite ways. Some traders use other technical indicators to confirm these kinds of reversals as well.
Now let’s briefly look at what the supply and demand trading strategy is.
Supply is simply, very aggressive selling, and demand is very aggressive buying. When there is a high supply, the market is more likely to go down (bearish market). When there is a high demand the market is more likely to go up (bullish market). The figure below shows supply and demand.
As you can see during supply there is a huge amount of red candles (bearish candles) that appear in the market. During demand, there is a huge amount of blue candles appearing in the market (bullish candles).

Now let’s look at the previous example (where we drew the Fibonacci retracement). As you can see from the chart below, there is a high demand (aggressive buying).
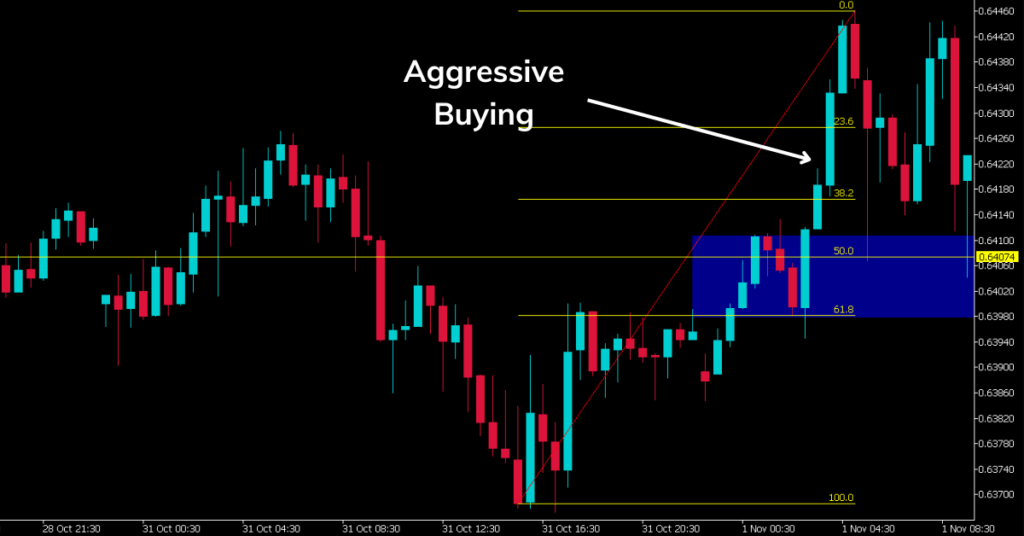
Here, we can expect the market to pull back to the demand zone. The demand zone is the zone where aggressive buying started to happen. This is highlighted in blue in the above chart.
As you can see, the demand zone is where the 50% Fibonacci level is as well. Isn’t that great?
This confirms a reversal in the market. As you can see from the chart below, the market reversed after it reached the demand zone & the 50% Fibonacci level.
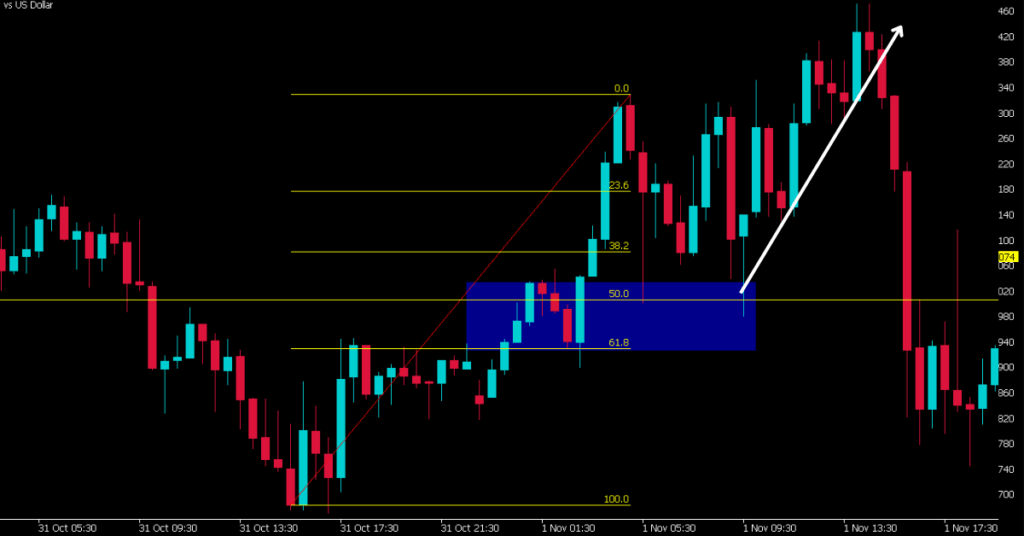
As you can see, when there is more than one confirmation of reversal, you can trust the reversal trade signal more. If you are interested in using these two strategies to enter the forex market, we recommend you backtest to familiarize yourself with, supply & demand and Fibonacci retracement.
Conclusion
In this article, we discussed how to enter a trade using the Fibonacci levels and also how to further confirm these levels using the supply & demand trading strategy. As discussed previously it is a good idea to back-test these trading strategies to familiarize yourself with it.

