In this guide, we will go over 5 effective forex trading strategies. These are strategies we use ourselves. these strategies are;
- Breakout Trading Strategy
- Reversal Trading Strategy
- Trend Trading Strategy
- Bolling Band Strategy
- Supply and Demand Strategy
Breakout Trading Strategy
The breakout strategy is a great forex trading strategy to trade with. In this guide, we will go over step by step how to utilize the breakout strategy to make profitable trades. Before you read this section make sure to go over the chart patterns because we will be utilizing chart patterns for the breakout strategy.
Most of the trades will be made within the 4-hour and 1-hour time frames. With this strategy, we will be looking for breakouts of all the chart patterns. This also includes up, down, and horizontal channel breakouts as well.
Let’s start with an example of a breakout. Below is a chart from the MT5 platform on android. As you see there are multiple breakouts occurring in the chart below. Can you identify different patterns that appear on the chart?
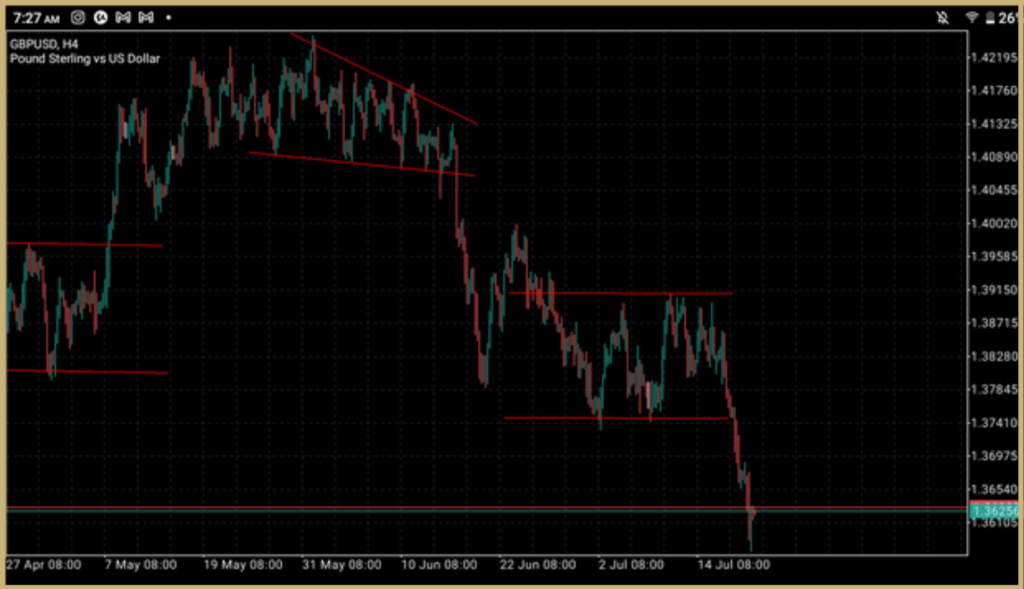
On the top, there is a falling wedge pattern. As you can see the pattern appears after an uptrend. If you cannot remember the pattern make sure to check the chart pattern reference sheet. With this pattern, there is always a chance of breaking out. It could break out in either direction. Before entering a trade it is always a good idea to wait till the breakout happens.
In this particular case, we see that a breakout happens downwards. You could have entered the trade just after the breakout happens in the direction of the breakout. Therefore, in this case, you will sell by the market. Depending on your risk-to-reward ratios you can place your take profit and stop loss. If you can remember how to calculate your risk-to-reward ratio make sure to check out the risk/reward ratio section in this app.
There is also another breakout that happened after a formation of a horizontal channel. This actually happened in the direction of the trend. Now let’s look at a few more examples of breakout. Below is a breakout that happened after a formation of a symmetrical triangle.
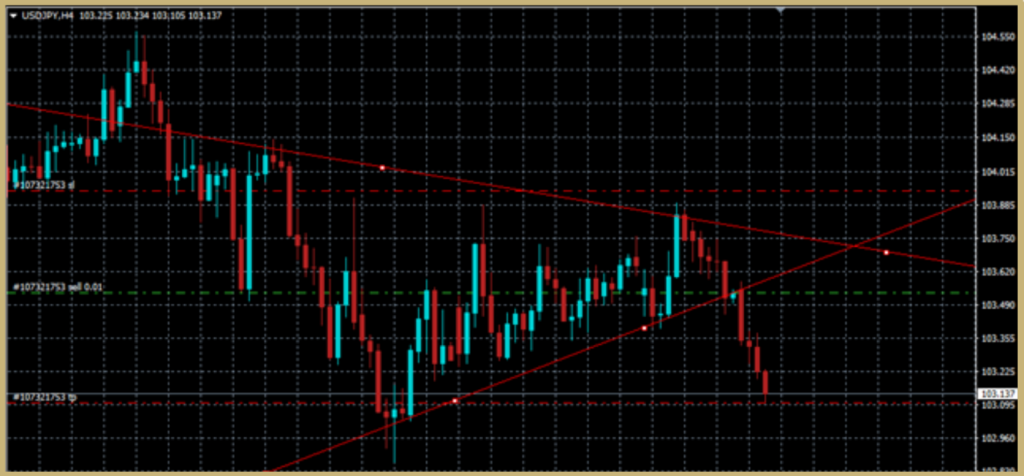
Before the symmetrical triangle was formed the market was in a downtrend. If you can remember, the symmetrical triangle is formed by an uptrend line and a downtrend line. At the end of a symmetrical triangle, there will always be a breakout. But, the direction of the breakout cannot be predicted with a 100% guarantee. So, it is a good idea to wait for the breakout to happen.
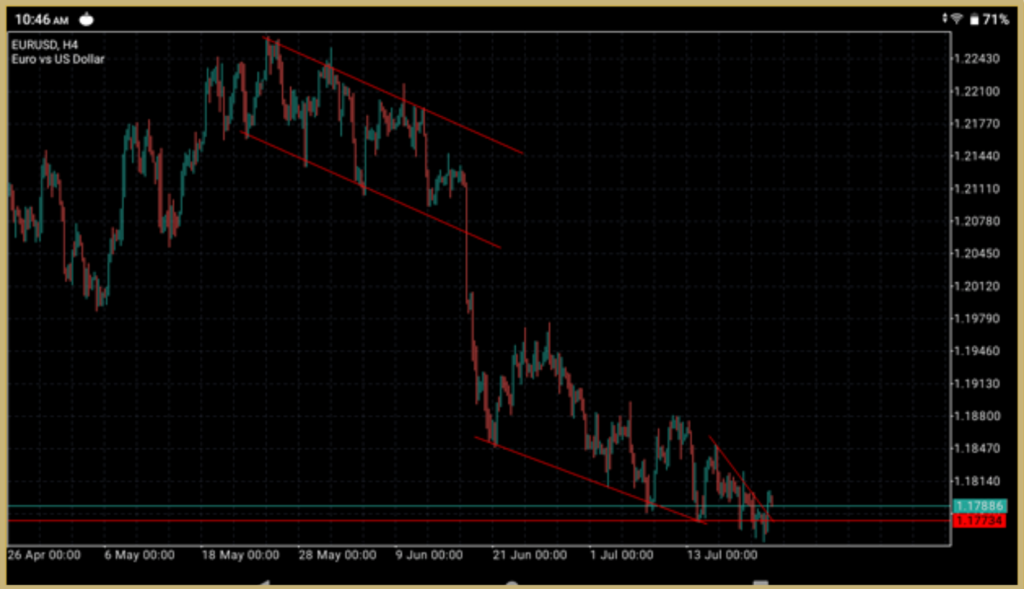
The above chart shows another breakout occurring after a formation of a downward channel. In this case, you can see a formation of very long red candles. This can confirm that the breakout will definitely happen downwards.
This is the breakout strategy. One of our favorite strategies to trade with. Make sure to learn about all the chart patterns and start trading with the breakout strategy.
Reversal Trading Strategy
A reversal trading strategy is an amazing strategy to make profitable trades. In this guide, we will go overstep by step how to utilize the reversal strategy to make profitable trades. Before you read this section make sure to go over the candlestick patterns because we will be utilizing candlestick patterns for the reversal trading strategy.
Most of the trades will be made on the 1-hour and 4-hour time frame, we don’t usually go below the 1-hour time frame. With this strategy, we will be trading based on reversal confirmation by different candlestick patterns.
Let’s start with an example of a reversal. One of the powerful ways to trade using the reversal candlestick patterns is to trade within a channel. The chart below shows a reversal pattern that occurs within a horizontal channel.
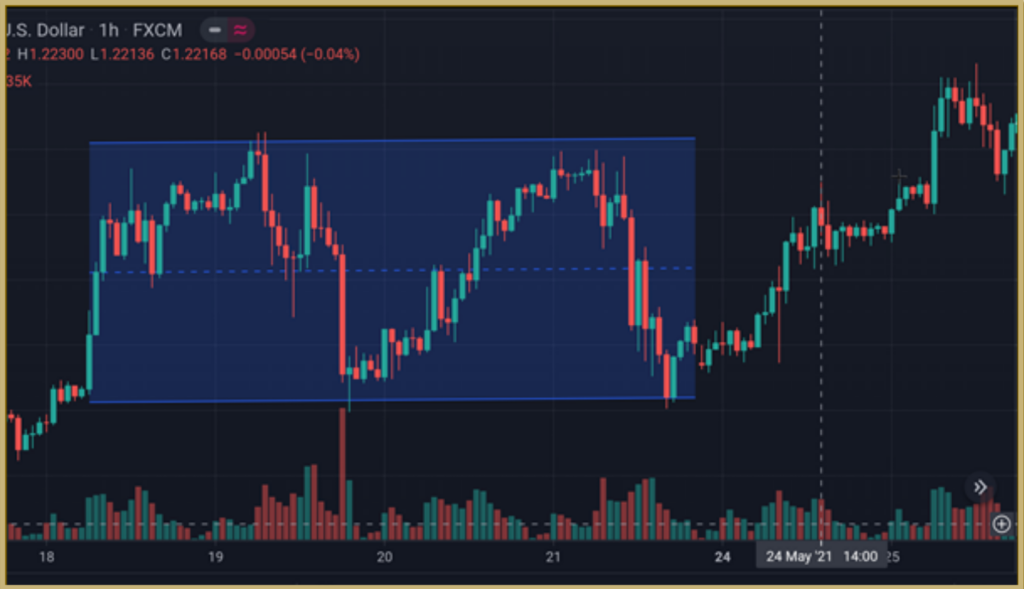
There are a few things that you should be able to notice. Within the horizontal channel, you see a reversal and a double-top pattern. To the top right of the channel, there’s a formation of a shooting star candlestick pattern. Also, after the shooting star, there is a dragonfly Doji. But, for dragonfly Doji to be applicable the market must be in a downtrend, therefore you can discard that pattern formation. On the other hand, the shooting star is a bearish reversal pattern, and the market should be in an uptrend, which it is in this case. therefore, you can expect the market to reverse its direction.
After the shooting starts there is a minor period of indecision in the market as shown by the formation of Doji candlesticks. After that, there is a formation of a bearish engulfing pattern, which is a strong indication that the market is going reverse. You can enter a trade after the formation of this candlestick pattern and exit the trade at the bottom of the channel.
Now, let’s look at another example of reversal. The chart below shows a formation of an up channel. There are multiple reversals occurring within this channel.
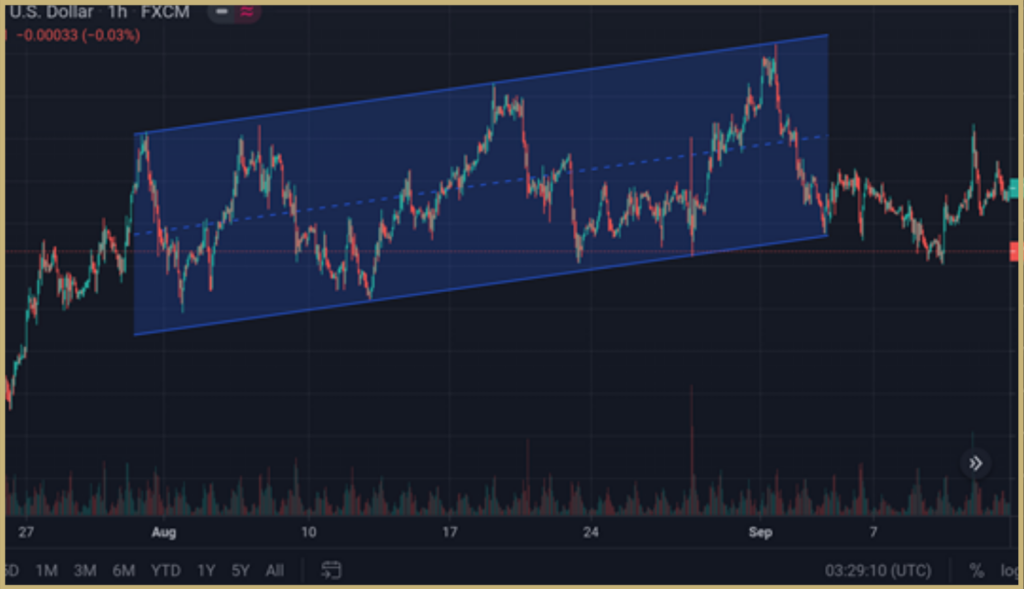
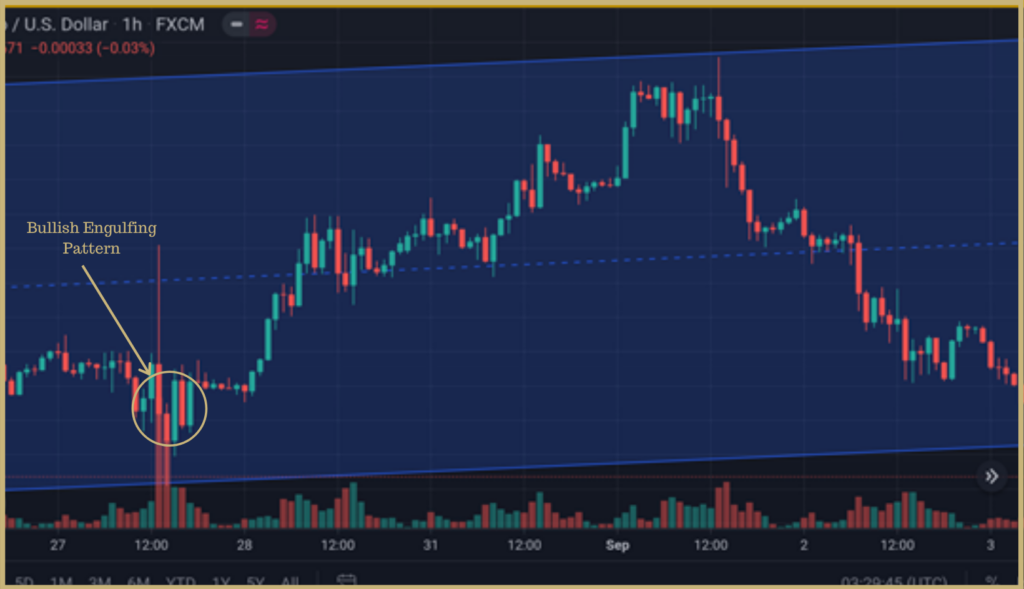
The image below shows a zoomed-in version of the channel. As you can see there is a bullish engulfing pattern formed near the support to the left of the image. This is a confirmation of the reversal. You can enter the trade after the formation of the bullish engulfing pattern and exit the trade at the resistance.
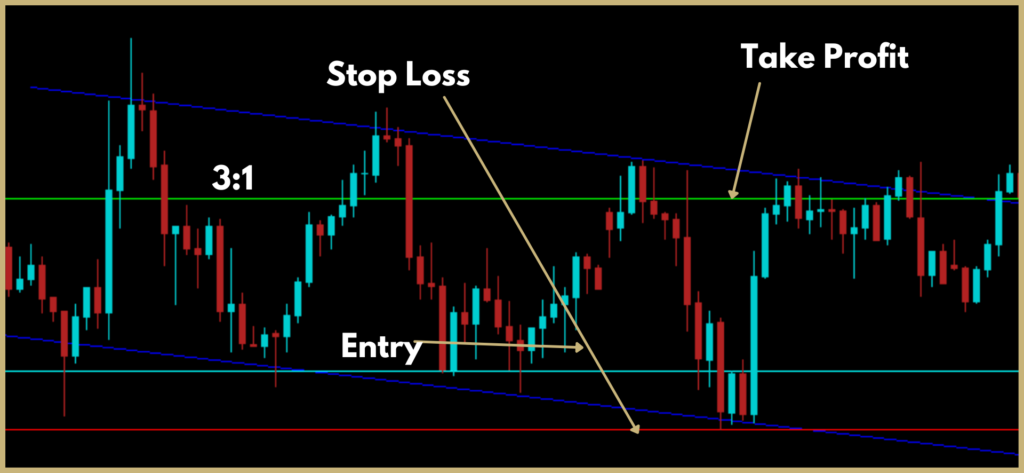
The chart below shows another example of reversal. As you can see there is a down channel in the chart. You can enter the trade when the market hits support as shown below. You can take profit based on your risk-to-reward ratio (3:1 in this case)
Trend Trading Strategy
“Trend is your friend”. Trend trading is one of our favorite trading strategies. If you can catch a trend you can make some serious money out of it.
Most of the trend trades will be made in the 4-hour time frame. With this strategy, we will be looking for trends. This includes both up and down trends. We will also be using a simple moving average indicator to confirm trends. The moving average indicators we will be using are the 50 SMA and the 20 SMA.
Uptrend Example
Let’s start with an example of a trend. Below is a chart from the MT4 platform.
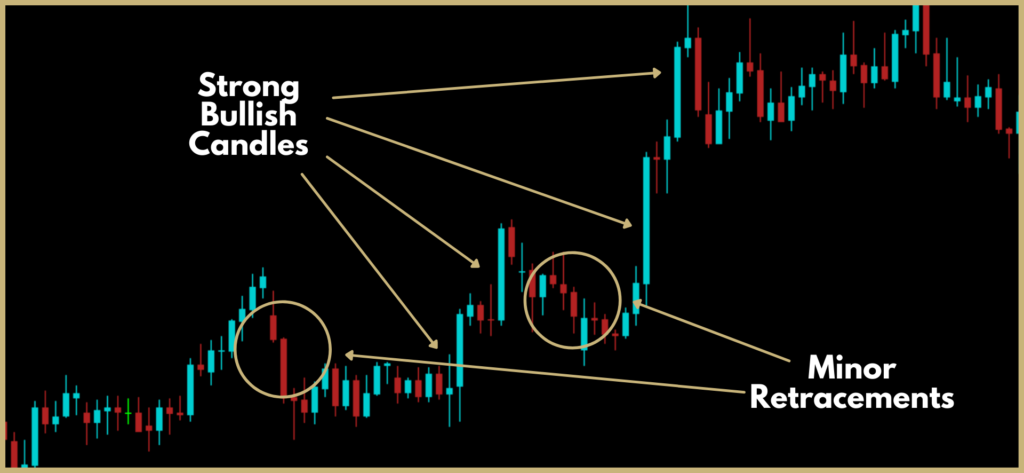
As seen from the chart the market is in a clear uptrend. The uptrend is confirmed by strong bullish candles. There are minor retracements as you can see. The majority of trades will confuse the retracements with major reversals. This is something that you must not do.
Yes, you can make money with those reversals but you can make significantly more by catching the trend. This of course is only possible when the market is trending. If the market is ranging we recommend you use the reversal strategy.
Now, let’s add the 20 (yellow) and 50 (red) SMA to the chart. As you can see there are two crossover points. As you can see the market trends between the two crossover points. Usually, the crossover points are an indication of a reversal.
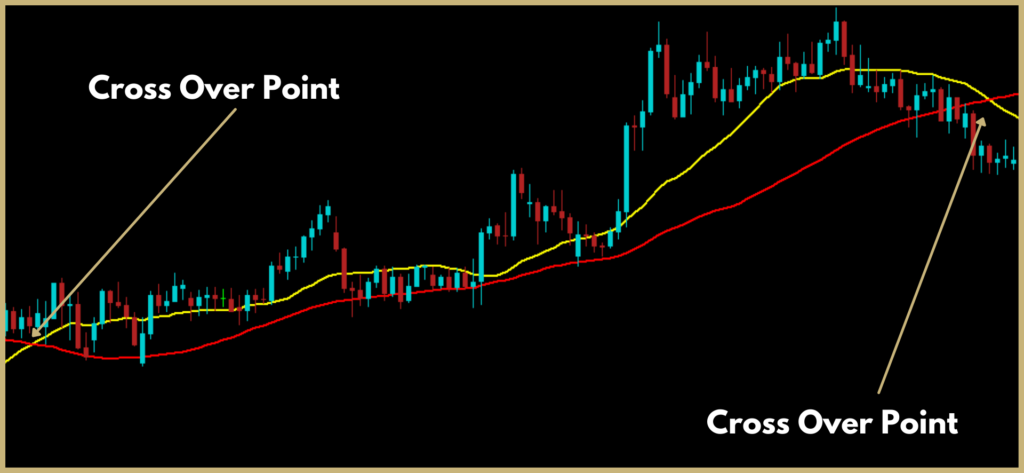
The simple moving average works best in a trending market. In a ranging market, you can use an indicator like the Bollinger band which works best in that kind of market.
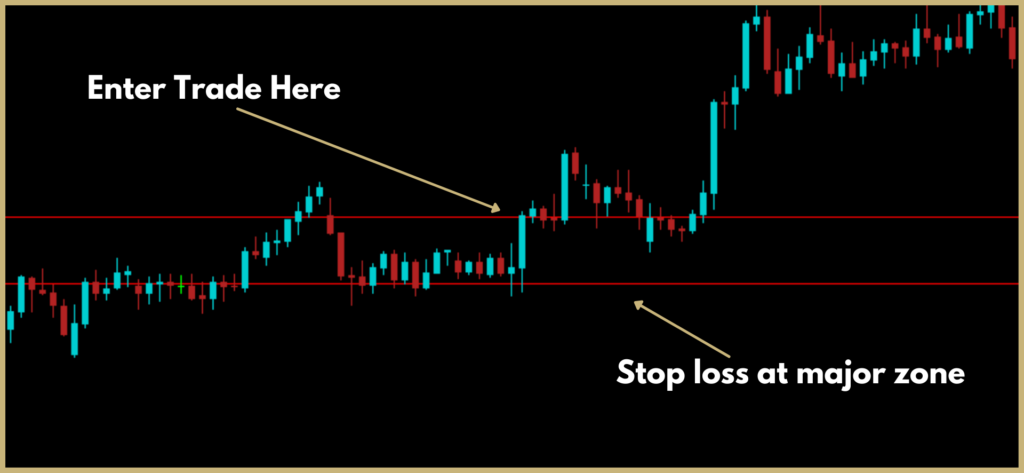
Now let’s talk about where you could have entered the trade. To enter a trade you need to look for great entry points. For trend trading, you need to wait for the market to be already trending. A decent entry point will be the SMA crossover.
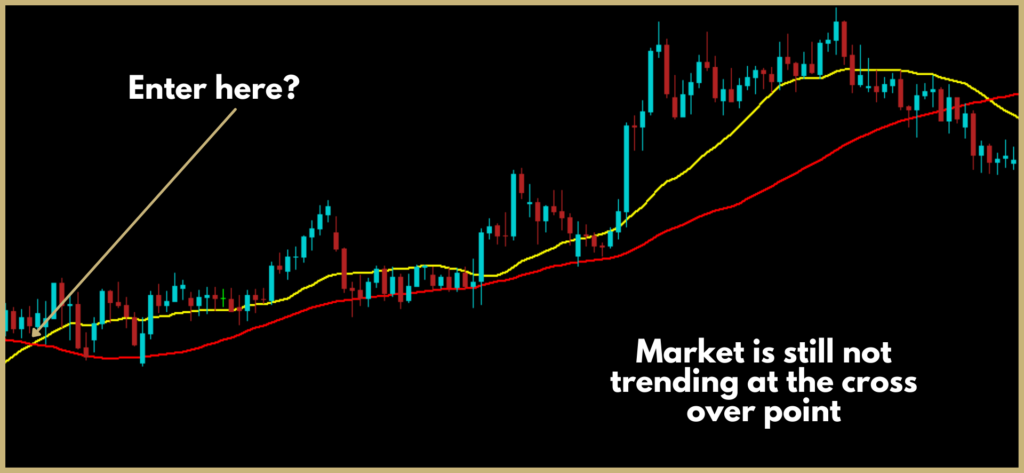
But to further confirm, wait for at least a couple of higher highs and higher lows for an upward-trending market. Then you need to further look for strong bullish candles as well. A good place to enter is at the following candle formation.
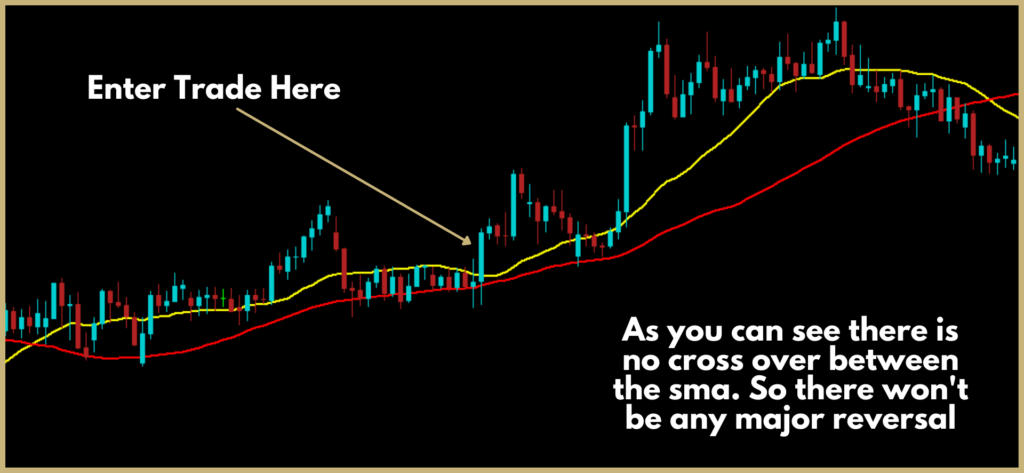
Now the question becomes where you exit the trade and place the stop loss. A great place to have a stop loss is a major zone as shown below.
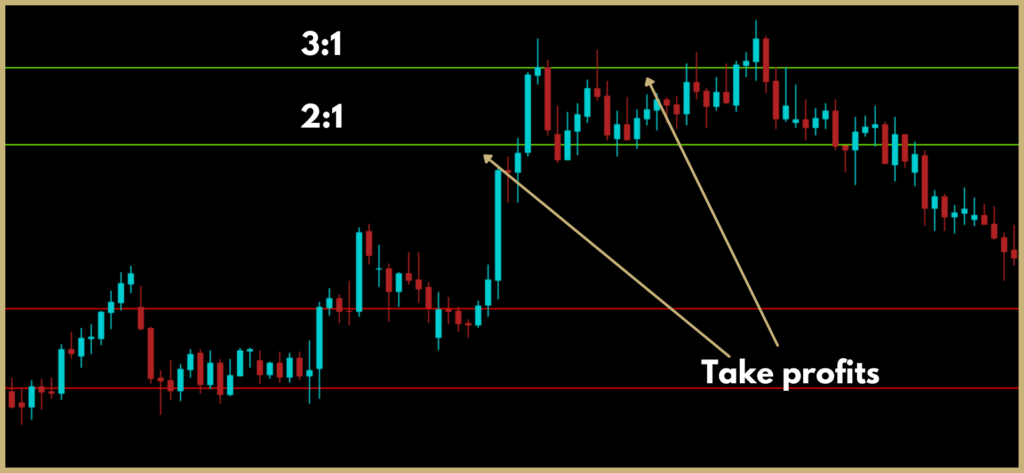
Place your take profit depending on the risk-to-reward ratio. You can use our set risk-reward ratio calculator to know where to place your take profit. The lines below show two different risk-to-reward ratios, 2:1 and 3:1.
Downtrend Example
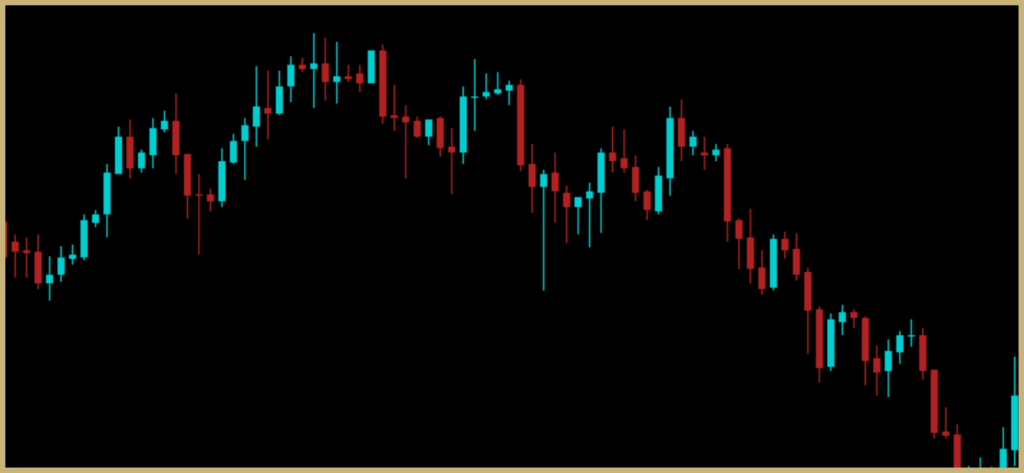
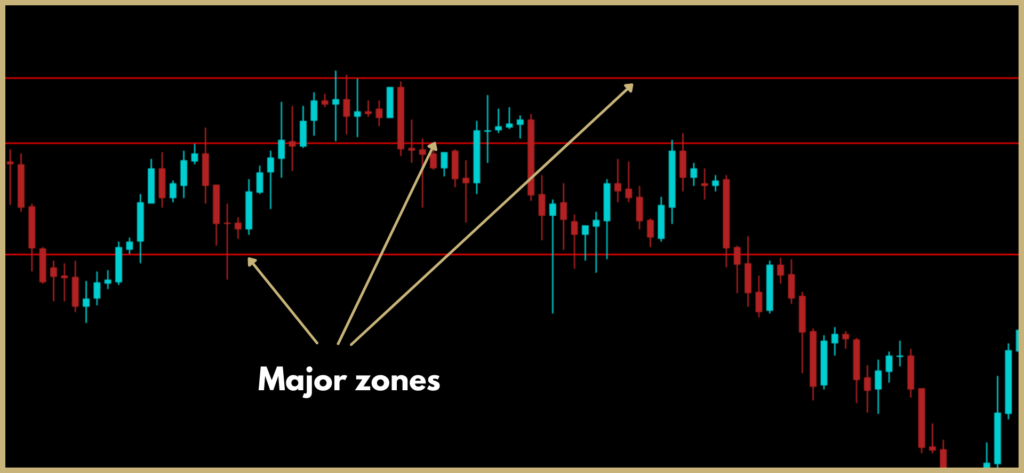
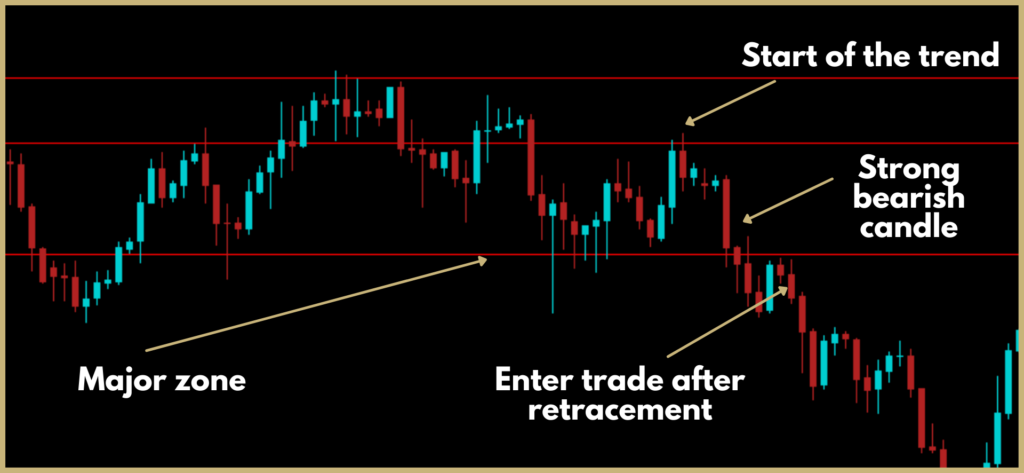
Look at the chart below. You can see that there is a strong breakout of one major zone with a strong bearish candle. Then there is minor retracement that occurs. You can enter the trade after the market touches the major zone and bounces back. Take profit depending on your risk-to-reward ratio.
Supply and Demand Strategy
Trading with supply and demand is a really great way to trade. Most of the supply and demand trades are done on a 15-minute chart.
A supply zone is a zone where aggressive selling happens. A demand zone is a zone where aggressive buying happens. The chart below shows a supply zone marked.
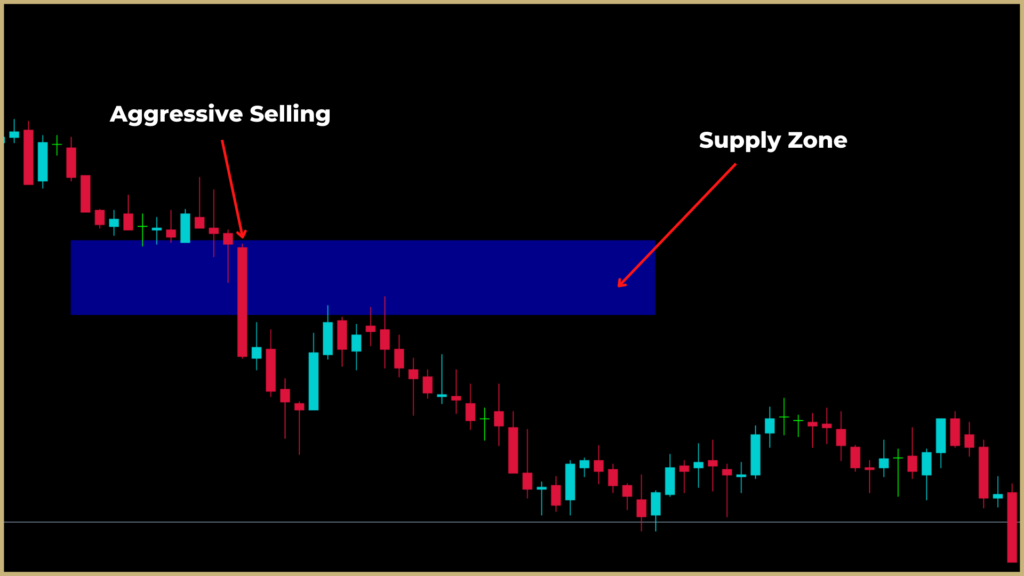
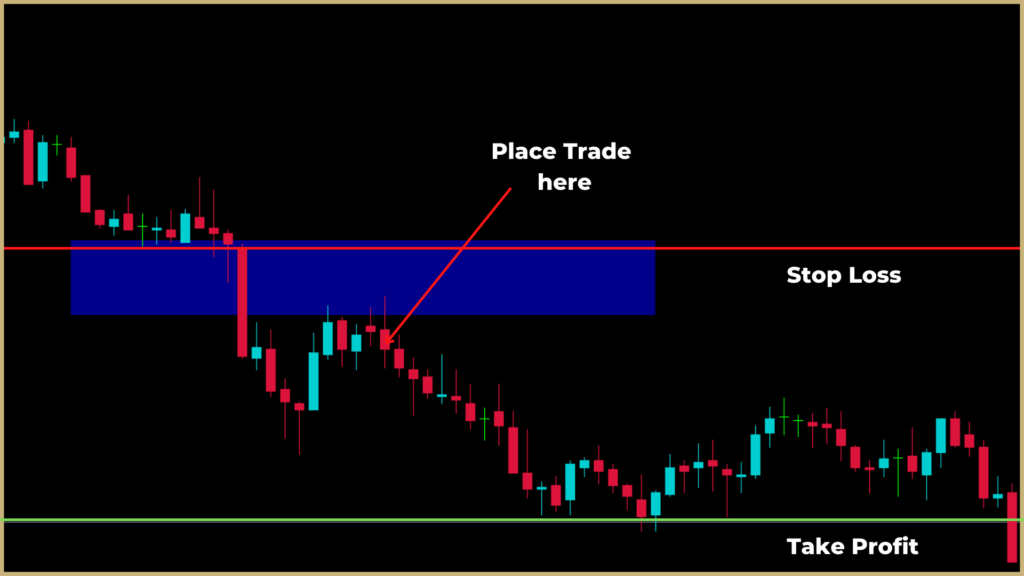
As you can see, the market usually pulls back to the supply zone. And then continues in the opposite direction. Finding this kind of supply zones can give you some nice trades. You can place the trade when a good candlestick pattern is formed in the supply zone. As you can see below you can take a nice profit with a 1:2 risk-to-reward ratio.
Bollinger Bands Trading Strategy
Let’s talk about a very effective Bollinger band trading strategy. This strategy is based on the reversal from the Bollinger bands. For this, we will be using Bollinger bands in conjunction with price action. If you cannot remember Bollinger bands make sure to check out the Bollinger bands section.
Now, let’s look at a couple of examples of this strategy. The chart below shows Bollinger bands in a slightly trending market.
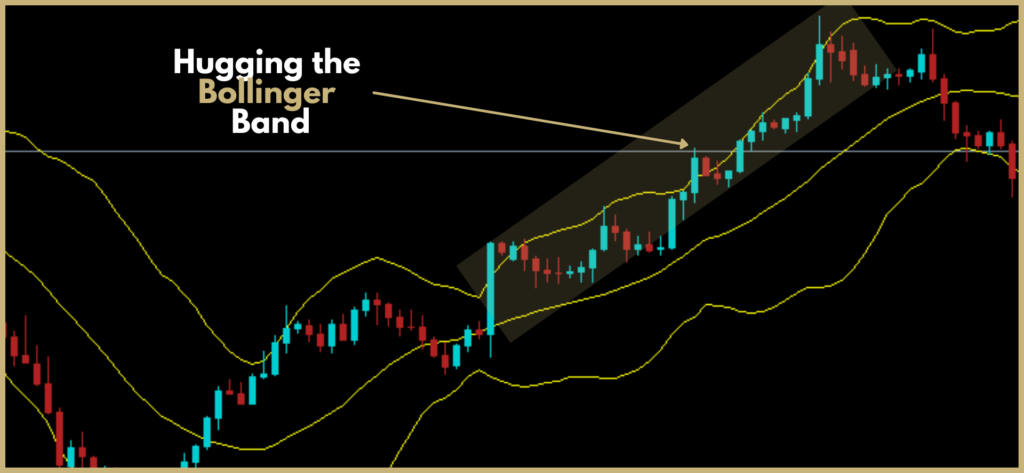
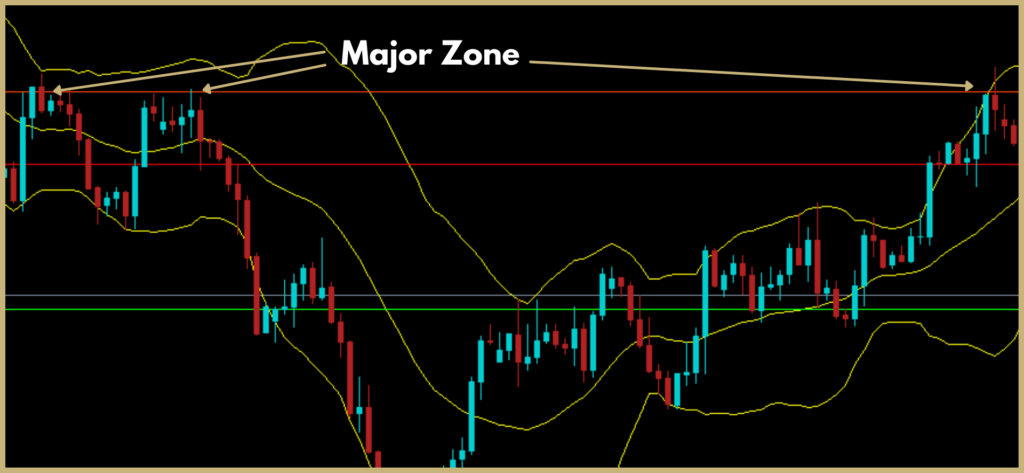
As you can see the market hugs the upper Bollinger band. And at one point, the market reverses, this is a good point to enter a trade. Also, an interesting thing to notice is that the market hits a major resistance/support zone as shown below.
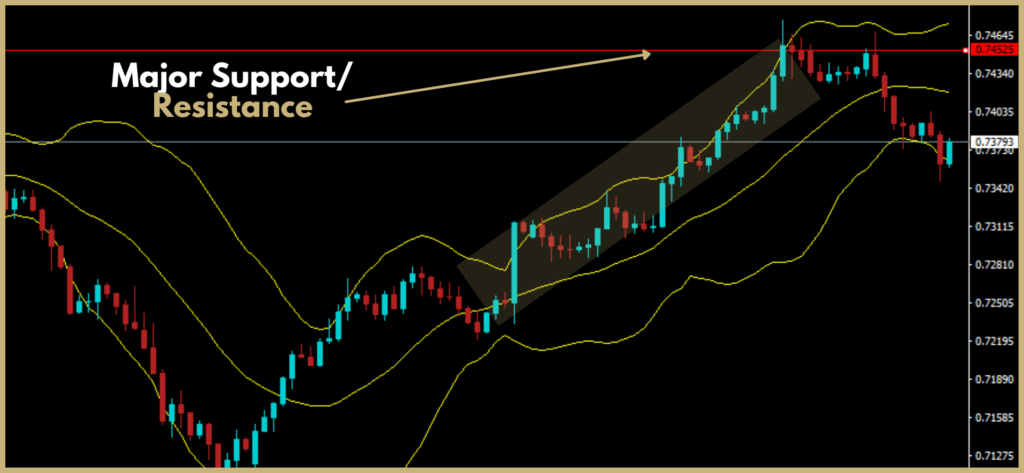
If you go back in the chart you will notice that the major zone is tested several times.
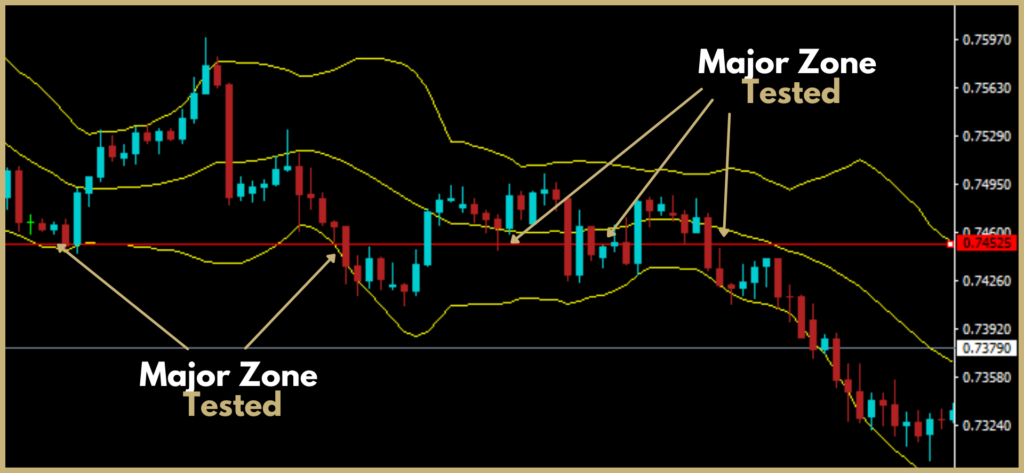
Therefore, after the market hugs the Bollinger bands and moves away from it, and hits a major resistance zone you expect the market to reverse. You can place a trade just after the reversal and place your take profit based on your risk-to-reward ratio.
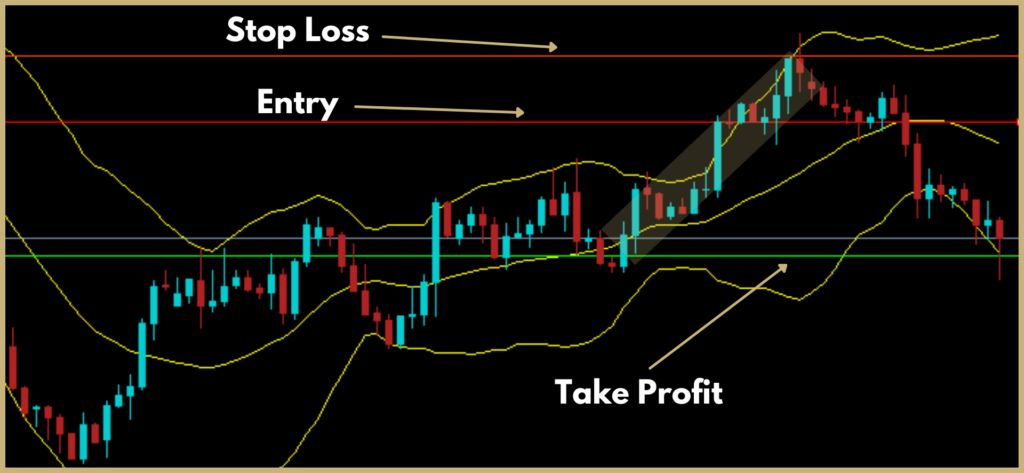
Below is another example of a Bollinger band reversal trade. Again the take profit is placed based on the risk-to-reward ratio.
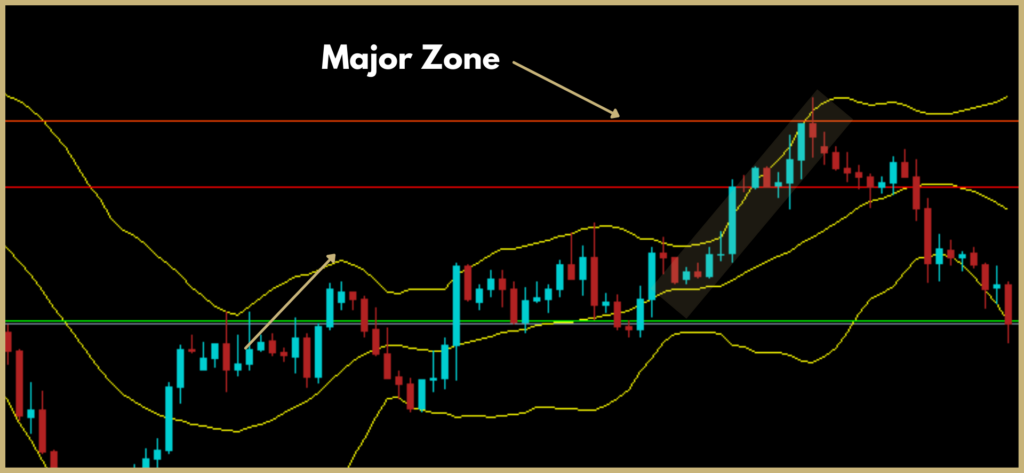
The market reversed when it stop hugging the upper Bollinger band and when the market hits the major zone.
Final Thoughts
These are 5 effective forex trading strategies that we use ourselves. We also recommend that you start trading with one strategy first that you prefer. Then you can slowly expand 2 or 3 trading strategies.
Top Forex Brokers
Best for Low Spreads | Best for Speed | Best for High Leverage |
 Fusion Markets is one of the top brokers that provide traders with low spreads (Risk warning: 76% of retail CFD accounts lose money) |  BlackBull markets is a great broker that provides traders with fast executions speeds. (Risk warning: 76% of retail CFD accounts lose money) |  Exness is a highly regulated broker that is best for high leverage trading. (Risk warning: 76% of retail CFD accounts lose money) |


